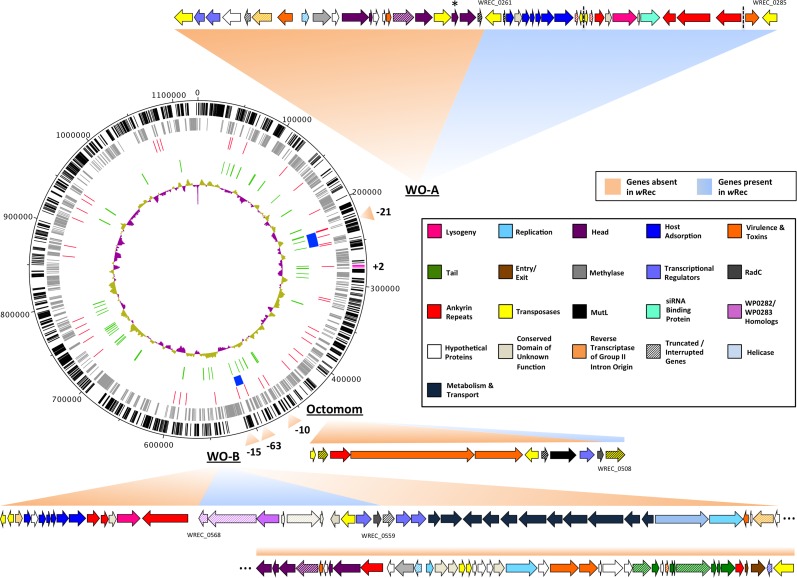
Figure 2. wRec genome comparison to wMel.
wRec scaffolds were concatenated in the order in which their genes appear in wMel to produce the circular genome above. Major regions of loss or gain compared to wMel are indicated outside the circle along with the number of genes involved. wRec genome features are indicated within the circle plot as follows (from outside-in): 1 (black): CDS in forward direction, and (magenta) genes not found in wMel; 2 (grey): CDS in reverse direction; 3 (red): scaffold break points; 4 (blue): WO regions; 5 (green): transposases and reverse transcriptases; 6 (purple/gold): GC content variation from average. WO prophage and related regions are shown and genes are categorized by color according to their likely functions and presence/absence in wRec. Locus tags for selected genes are indicated and dashed lines indicates breaks between scaffolds containing WO-A. The minor capsid gene of WO-A, which was used for prior PCR screens, is indicated with an asterisk.

