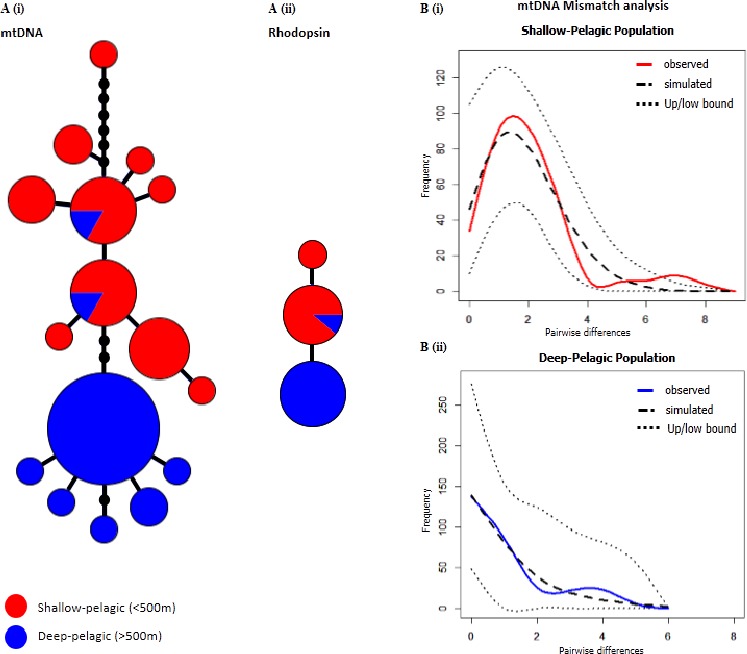
Figure 1. Comprehensive image of mtDNA and Rhodopsin genetic divergence and Mismatch Distributions.

S. mentella genealogies for mtDNA (n = 50; 25SP + 25DP) and rhodopsin (n = 22; 10SP + 12DP), and mtDNA mismatch distributions. (A) Haplotype network for the shallow (red) and deep (blue) groups for mtDNA (i) and rhodopsin (ii). The size of each circle represents the proportion of haplotypes. The lengths of the connecting lines reflect the number of mutations between haplotypes. (B) Mismatch distributions from the mtDNA sequences of shallow (i) and deep (ii) groups, respectively from above and below 550 metres depth respectively. Dotted lines (Up/low bound.) represent the 95% boundaries of the simulated distributions.
