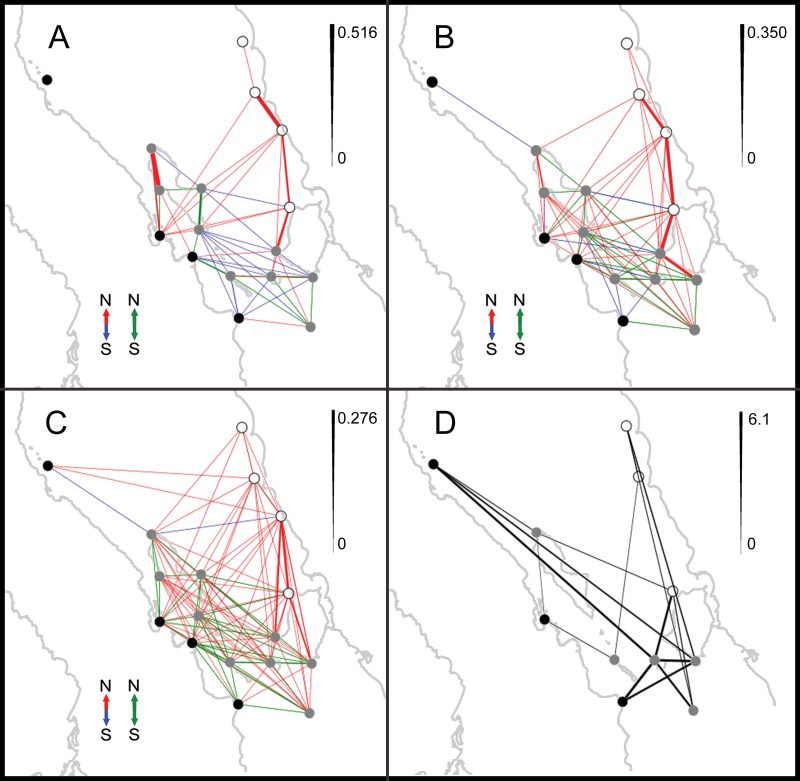
Figure 4. Modeled and empirical networks of larval connectivity.
Spatial networks of larval dispersal between sites for PLD 14 days (A), 21 days (B) and 28 days (C), and conditional genetic distance from a population graph based on mtDNA sequence data (D), showing dispersal events (links) between sites (nodes). In (A)–(C) line width is proportional to probability, according to the scale to the right; the direction of the larval dispersal events is indicated by different colors: northward (red), southward (blue) or both simultaneously (green). The empirical network is undirected and line width is proportional to conditional genetic distance according to the scale. Black nodes belong to “Baja” geographic group, grey nodes belong to “Midriffs” and blank nodes to “Sonora”.

