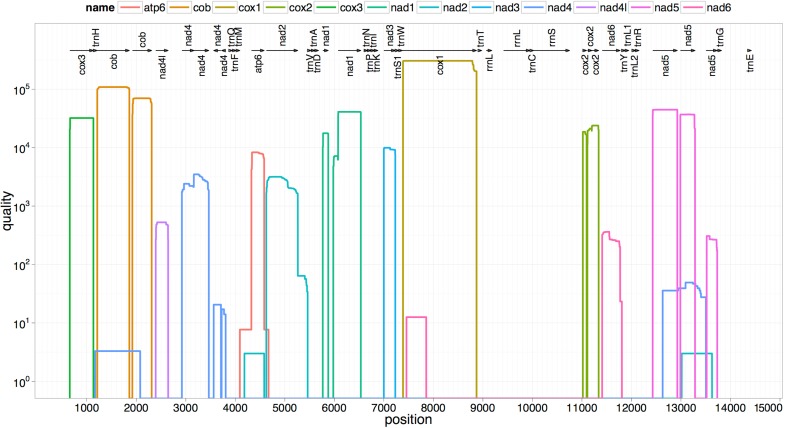
Figure 4. Summarized 12 protein coding genes and their blast hit protein plots.
The protein plot depicts the quality value for each gene and each position if it is above the threshold and the different genes are differentiated with a range of colour codes. The hits used in MITOS correspond to the “mountains” in this protein plot that visualizes the signal from the BLAST searches. The arrows shown on the top of the plot depict gene order annotation and the quality values are shown on a log scale.

