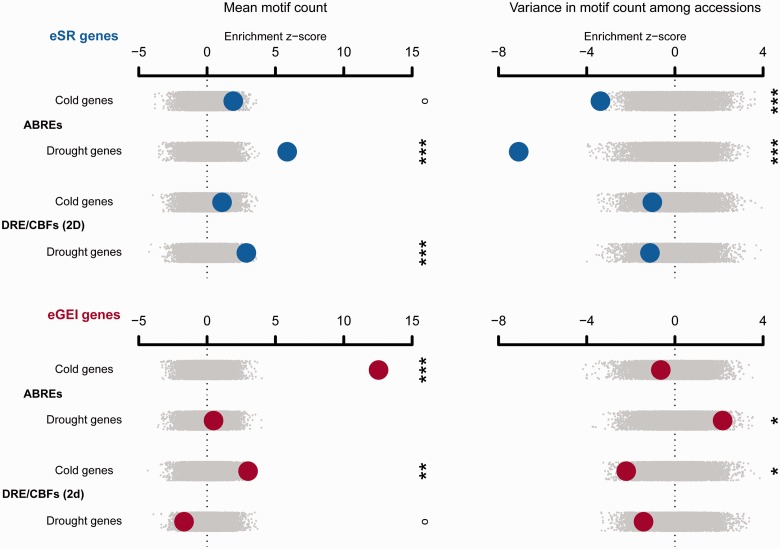
Fig. 5.
The enrichment of candidate gene sets with mean motif frequency or variance in motif frequency among 80 resequenced accessions. Observed enrichments are calculated as a z score using the distribution from null permutations. Enrichments are shown with large circles with eSR genes in the top rows and eGEI genes in the bottom rows. Null permutations are shown as small gray dots (°P < 0.1, *P < 0.05, **P < 0.01, ***P < 0.005).

