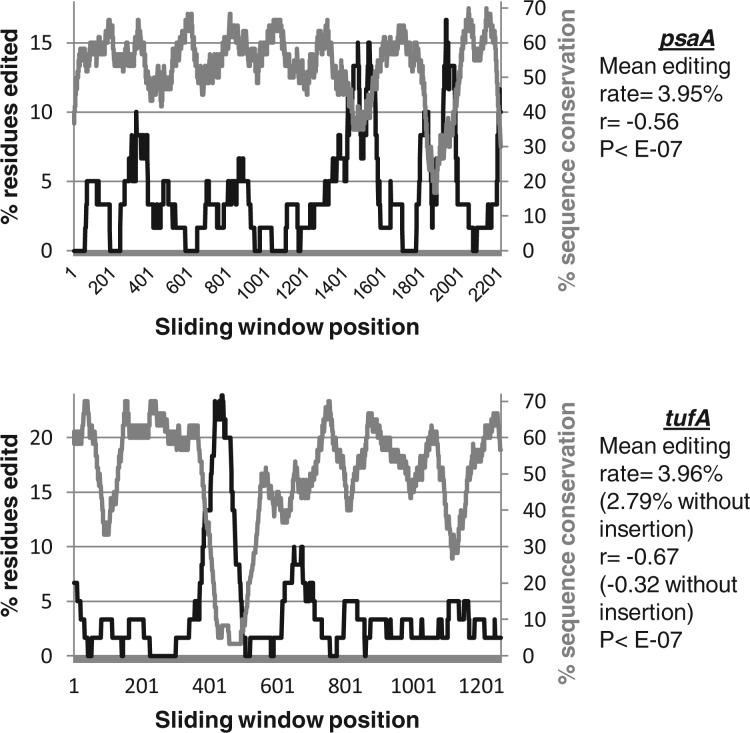
Fig. 4.
Editing is preferentially associated with highly divergent regions of Karlodinium veneficum plastid genes. These graphs compare the frequency of editing with sequence conservation in a 60-bp sliding window over the entire lengths of the Karl. veneficum psaA and tufA genes. The horizontal axis shows the starting position of each window within each gene sequence. The left hand vertical axis of each graph (black line) depicts the total percentage of nucleotide positions within each window that are edited within the transcript sequence. The right hand vertical axis (gray line) shows the proportion of amino acid positions within the predicted translation product of the transcript sequence of this window that are conserved with the predicted translation of the orthologous gene in the Emiliania huxleyi plastid. A table to the right-hand side of each graph shows the total proportion of editing sites over the entire gene, and the Pearson coefficient, and associated significance value of the correlation between sequence conservation and editing frequency. For the tufA gene, correlation coefficients are given both for the complete gene sequence (open figures) and for the gene sequence excluding the highly edited 84-bp insertion region specific to Karl. veneficum (bracketed figures). In all cases, a significant negative correlation is observed.

