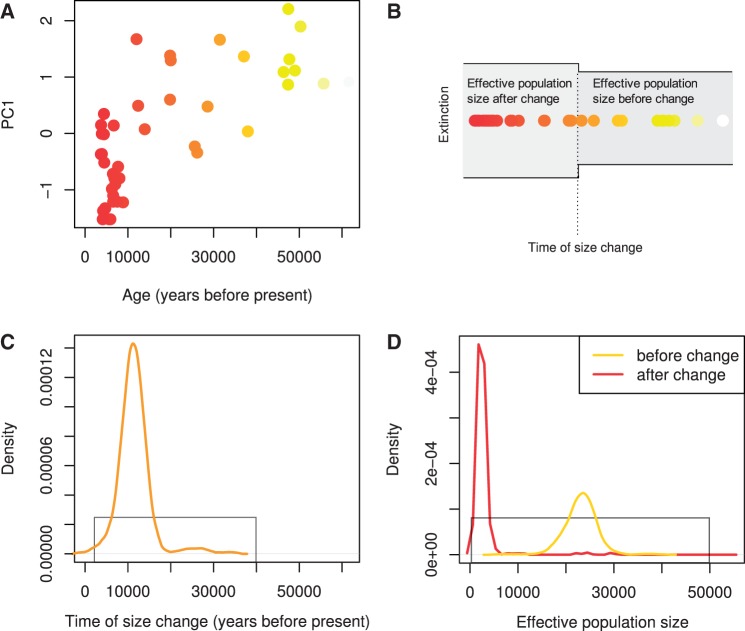
Fig. 8.
Approximate Bayesian Computation of Woolly Mammoth demographic history using PC1 loadings as summary statistics. (A) Plot of PC1 versus the age of the mammoth individuals. (B) Illustration of the three-parameter model of instantaneous size change. (C) Estimated posterior distribution for the time of size change. (D) Estimated posterior distributions of effective population size before and after the size change. Prior distributions in (C) and (D) are shown by the gray lines.

