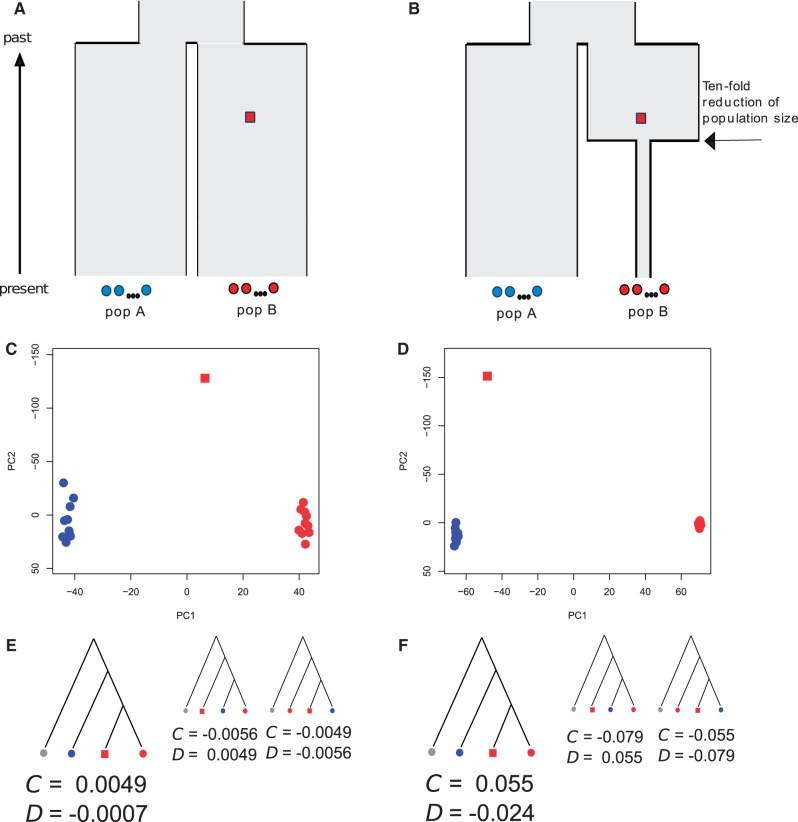
Fig. 9.
Comparing a single ancient genome to modern populations. (A) Population divergence model with constant effective population size. (B) Population divergence with a 10-fold population size reduction postdating the ancient individual. (C) PCA of 100,000 SNPs simulated under the model in (A). (D) PCA of 100,000 SNPs simulated under the model in (B). (E) Population topology inferred using C tests and D tests based on 100,000 independent SNPs simulated under the model in (A), and (F) population topology inferred using C tests and D tests based on 100,000 independent SNPs simulated under the model in (B). Values for the C-statistic are only positive for the correct topology, and absolute values of the D-statistic are lowest for the correct topology. The tree topologies displayed in (E) and (F) represent the three possible topologies tested and the larger trees represent the true topology (and also the one supported by the statistics). The gray circles in (E) and (F) represent an outgroup individual constructed from the ancestral alleles of each simulated locus. For details on these tests, see Materials and Methods.

