Fig. 1.
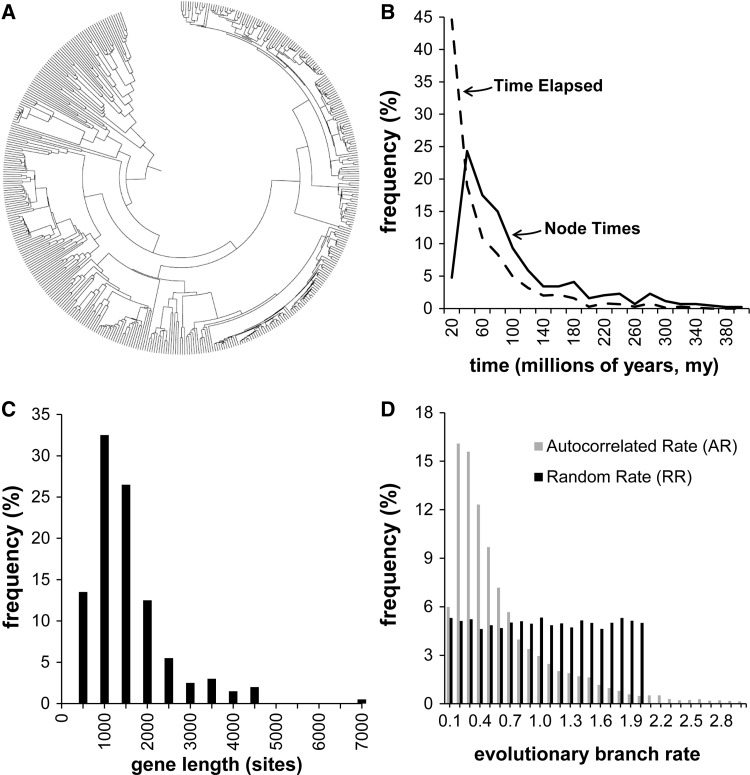
Model tree and substitution patterns. (A) A 446-taxa phylogeny used for computer simulations. (B) Distribution of node divergence times (solid line) in the tree. The dashed line represents the distribution of elapsed time along branches of the tree. (C) Distribution of simulated gene alignment length, based on empirically observed gene lengths. (D) Rates were varied in the simulations to span a variety of models and evolutionary patterns. Because we generally do not have knowledge of actual rate variation patterns in real situations, we used three types of simulated evolutionary rate variation: As a baseline, a CR scenario, one in which the rate variation among branches was autocorrelated (AR), and one in which the (expected) evolutionary rates varied independently on each branch based on a uniform distribution, as described in Materials and Methods. A histogram is shown of the distribution of simulated rates in each case, with the nominal rate set equal to 1.0. In the CR case, the length distribution would be represented by a single bin at x = 1.0.

