Fig. 3.
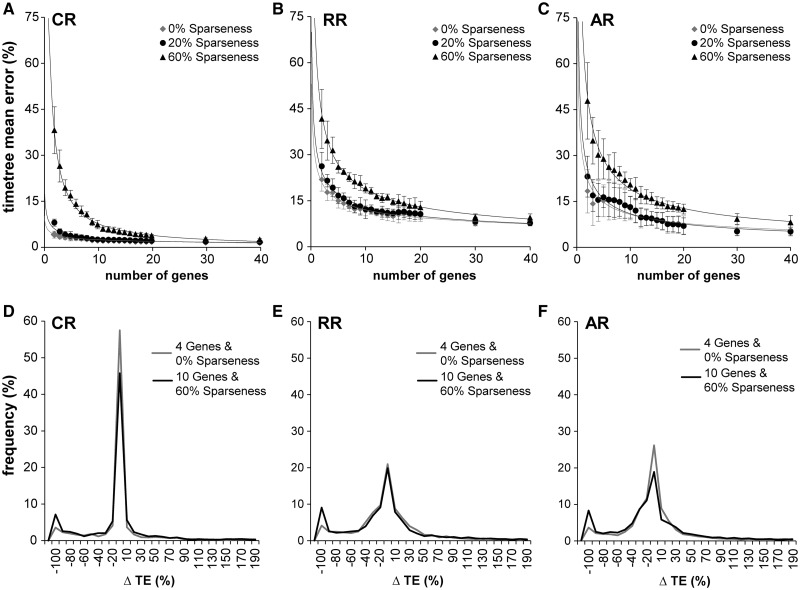
Effect of data sparseness on error. TE refers to time elapsed on a branch. (A–C) For each rate variation model and three different sparseness levels, the decline in error as more genes are added. In the CR case, there is virtually no difference between full data and 20% sparseness. 60% sparseness has considerably more error for fewer than ten genes, but as the number of genes increases, the error also converges to the full data levels. The RR situation is very similar but with error generally elevated over the CR case. AR shows a somewhat more pronounced difference between the full data and the 60% sparseness cases. (D–F) In these panels, we show the distributions of time estimate errors not for nodes, but for branches, in two cases, four genes with full data, and ten genes with 60% sparseness. In each case, there is the same number of sequences and taxa. We see that the distributions are virtually identical within each rate class, except for the left tail (−100% error case). These are cases in which the estimated branch lengths are zero. These are branches associated with nodes with zero data coverage (no genes with species in common to both child clades of the node). Such nodes have a substantial effect on mean error, but they can be easily detected a priori.

