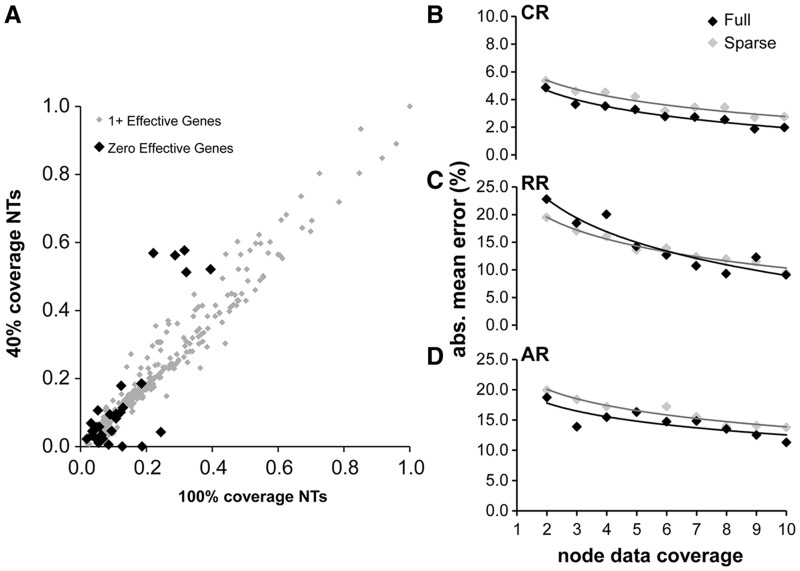
Fig. 6.
(A) A comparison of estimated divergence times based on ten genes and 60% sparseness is shown (RR rate model, other rate models give similar results). Nodes with zero data coverage are shown in black and have branch length time estimates of zero. These nodes are mostly shallow and have only a few species with data below them. (B–D) Relation between mean absolute value node time error and node data coverage for sparse (ten genes, 60% sparseness) and full coverage (zero sparseness, number of genes = node data coverage) in the CR, RR, and AR cases. The x axis is the node support and the y axis is the mean absolute value error for nodes with that amount of support. We see that, controlling for individual node support, there is very little, if any, difference in error between nodes in a sparse-coverage data set and in the full-coverage context.

