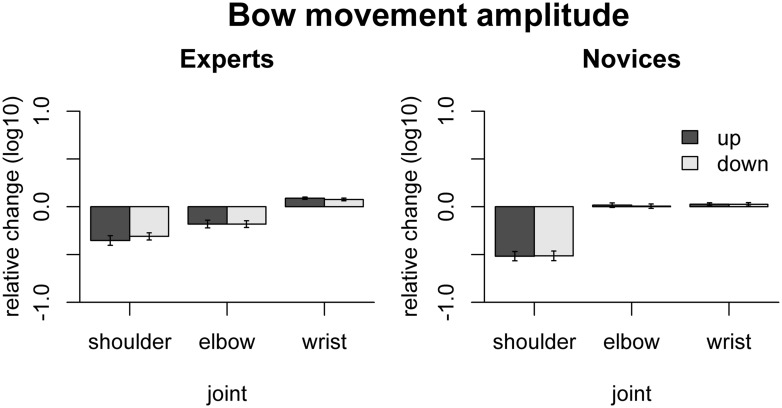
FIGURE 3.
Results of the freezing analysis for bow movement amplitude. The relative change is computed as the log10-transformed ratio between surrogate and original data. Thus, positive values indicate that freezing a particular joint leads to an increase in movement amplitude. Error bars indicate SE across participants.

