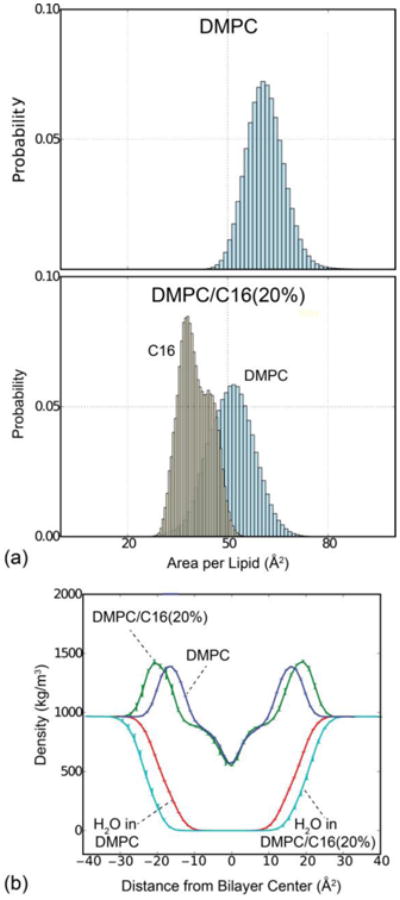
Fig. 2.

(a) Probability distribution of the area per lipid for pure DMPC (top) and DMPC/C16 mixtures (bottom). Within mixed bilayers, the area per DMPC is reduced to 51.0 ± 1.0 Å2 in the presence of C16 compared to 61.1 ± 0.3 Å2 for pure DMPC, as calculated by Voronoi analysis of MD simulation trajectories. (b) Mass density profiles along the perpendicular of the membrane plane for the complete systems (blue: DMPC, green: DMPC/C16) and for water only (red: DMPC, cyan: DMPC/C16). Total mass density profiles reveal a bilayer thickness of 32.3 ± 0.2 Å for DMPC, which is enlarged to 40.0 ± 0.4 Å in the presence of 20% C16. This change is reflected in the water density profile for both samples.
