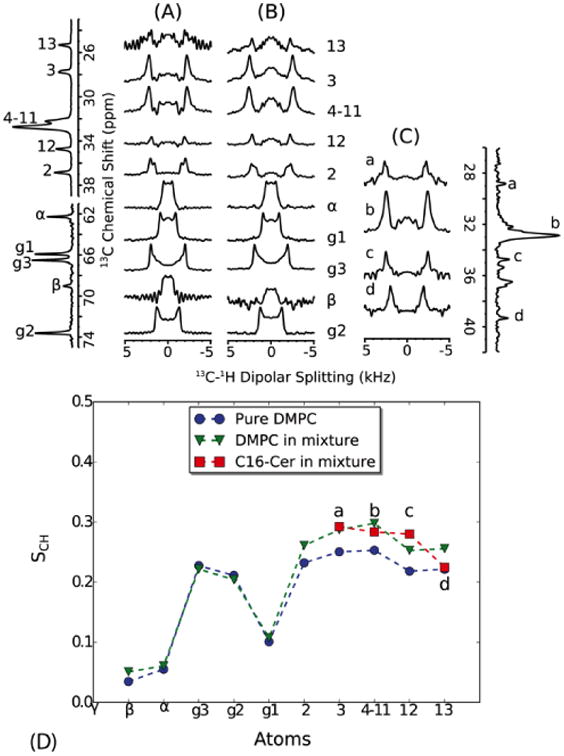
Fig. 5.

Dipolar C-H order parameters of DMPC were extracted from dipolar splittings obtained from pure DMPC (A) and from a mixture of DMPC/C16 (20%) (B). The order parameters of C16 were obtained from a sample of DMPC-d67/C16 (20%) in which the 13C-DMPC resonances show much reduced cross polarization intensities (C). The 1D spectra on the left and right are 13C spectra of DMPC and DMPC-d67/C16 (20%), respectively. The order parameters are plotted along the lipid carbon positions (D). Resonance b in C16 corresponds to the main CH2 signal, but the other resonances are not assigned and are therefore plotted as “smoothed” order parameter profile in order of increasing chemical shift. Both C16 and DMPC show a similar degree of chain order, which is higher than pure DMPC. All spectra were recorded at 325 K. At this temperature, both C16 and DMPC are within a fluid phase within the mixture as judged from 1H-MAS NMR spectra (Fig. 6). Dipolar couplings were calculated by dividing the dipolar splittings by the FSLG scaling factor (0.577 for CH and 0.816 for CH2). Order parameters were calculated from the ratio of the measured dipolar couplings to the rigid single bond 13C-1H bond dipolar coupling (21.5 kHz [35]).
