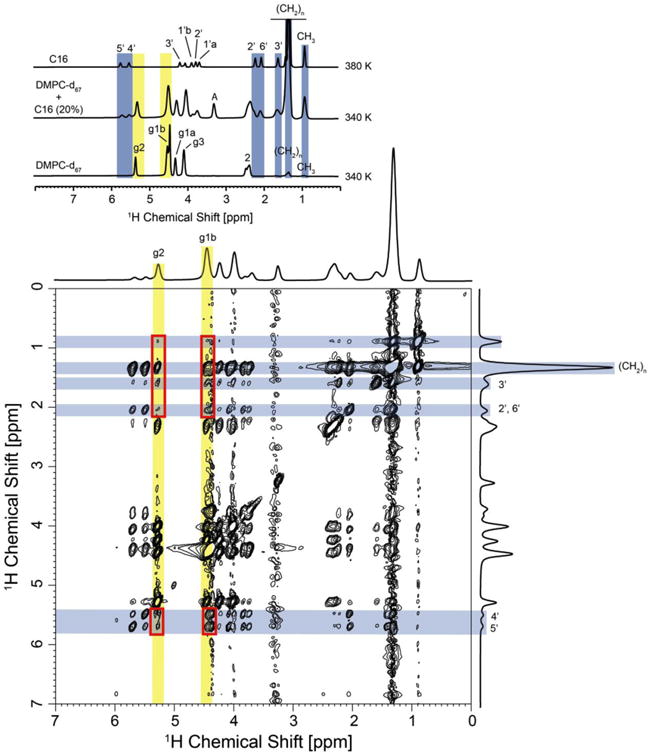
Fig. 7.

1H-MAS NOESY spectrum of DMPC-d67/C16 (20%) in D2O recorded at 340 K, 10 kHz sample rotation rate and a mixing time of 1000 ms. An analysis of intermolecular DMPC – ceramide cross peaks was restricted to DMPC protons g2 and g1b, which show no overlap with ceramide proton resonances (see top insert). A number of intermolecular contacts have been observed, such as correlations between protons g2 and g3 in DMPC with protons CH2, 3′, 2′, 6′, 4′ and 5′ in C16. Cross peaks are highlighted with red boxes. Unambiguously assigned lipid and C16 resonances are highlighted in yellow and blue, respectively.
