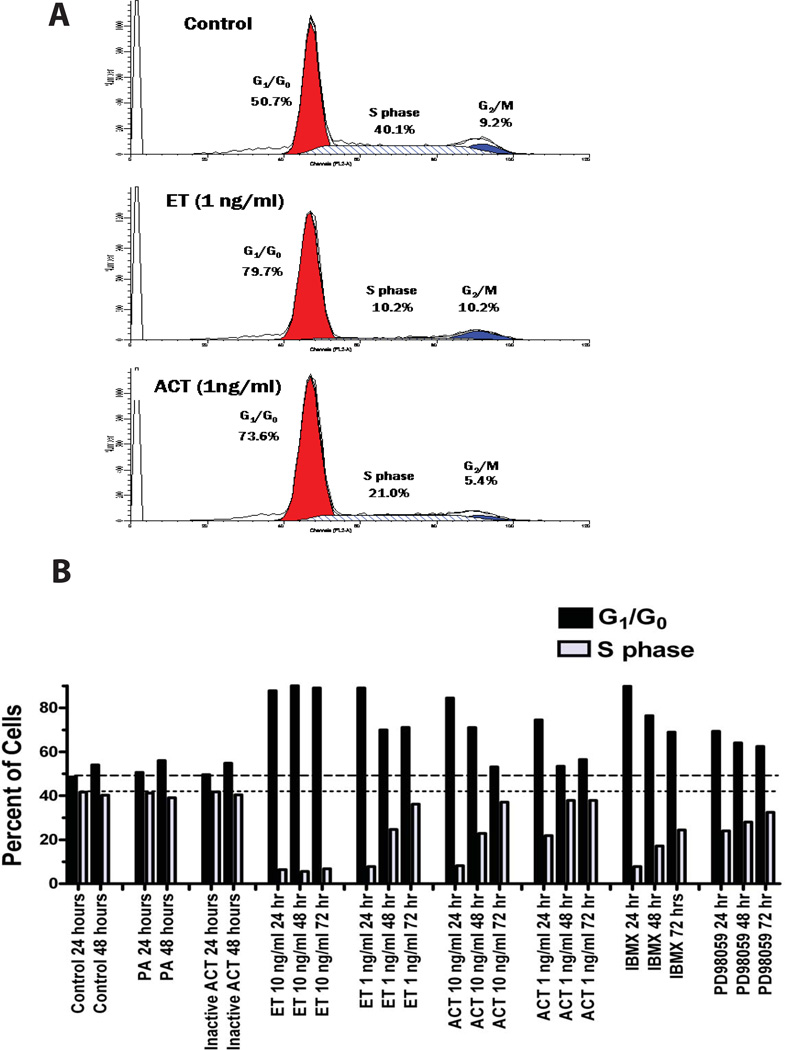
Figure 2. ET and AC toxin cause an increase in the proportion of J774 cells in G1/G0 and a reduction in S-phase that is cAMP dependent.
A) J774 cells were treated with ET or AC toxin for 24 hours and cell cycle measurements made as described in Experimental Procedures. B) J774 cells were treated as indicated for 24, 48, and 72 hours and the percentage of cells in G1/G0 and S-phase shown. Both panel A and B represent a single experiments but are representative of at least 4 independent experiments. The apparent differences between control and ACT-treated cells in G2/M in the representative experiment shown in panel A did not occur in aggregate data (G2/M for control cells = 7.7 ± 2.4% and for ACT-treated cells = 6.0 ± 2.5, n = 4, p = 0.378)

