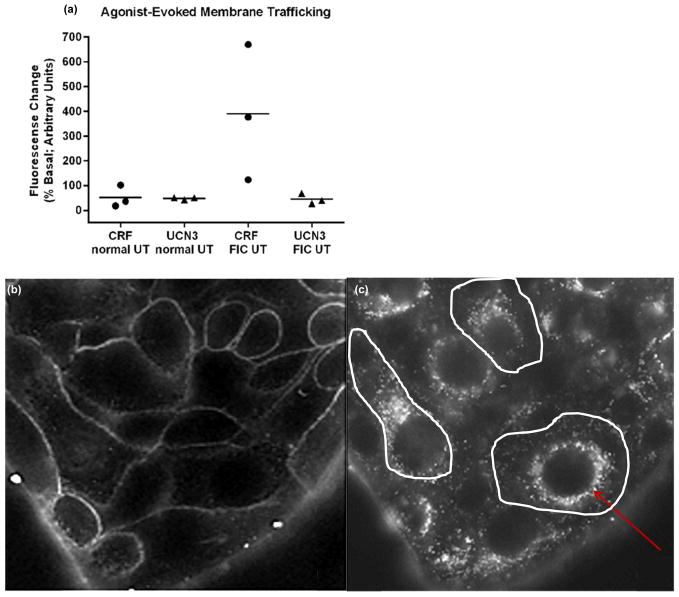
Fig. 4. Selective CRF-R1- and CRF-R2- agonist evoked UT membrane trafficking in vitro.
(a): In normal UT, CRF-R1 and CRF-R2 activation (CRF 0.01μM; closed circles and UCN3 0.1μM; closed triangles, respectively) evoked membrane exocytosis of a similar magnitude (p>0.05; n=3). By contrast in FIC UT, membrane exocytosis in response to CRF-R1 activation was significantly greater than that evoked by CRF-R2 activation (p<0.05; n=3). Mean release is indicated by horizontal bars.
(b–c): Characteristic image stills from time-lapse experiments using FM1-43 (5μM). In b: the cells are bathed in HBSS+FM-1-43(5μM) and unstimulated; in c: the UT cells exhibited a large membrane exocytosis in response to CRF-R1 receptor activation (CRF 0.01μM) as shown by the large number of fluorescent punctae in the cytoplasm. Following washout of dye from the bath, the plasma membrane is no longer visible-white lines delineate its presence. Endocytosed dye-containing vesicles gather around the nuclei in almost all cells, shown by the red arrow.

