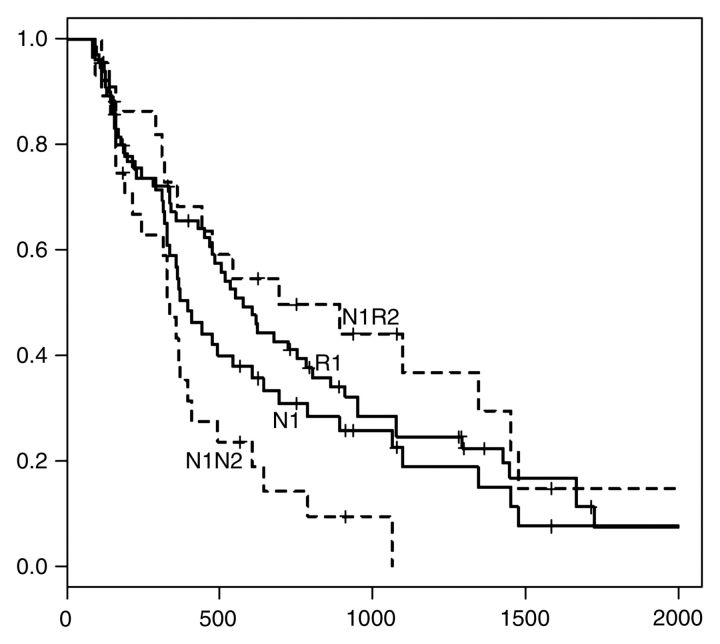
Figure a:
Kaplan-Meier survival curves obtained with (a) EASL criteria and (b) mRECIST. Although patients who responded to first chemoembolization (R1) showed a tendency toward longer survival compared with those who did not (N1), the difference was not statistically significant (P = .16, P = .28, and P = .49 at 1, 2, and 3 years, respectively, with EASL criteria; P = .518, P = .276, and P = .849 with mRECIST). After second chemoembolization, N1 patients were divided into two groups: those who responded to second chemoembolization (N1R2) and those who did not (N1N2). N1R2 patients had significantly greater 1-, 2-, and 3-year survival times than did N1N2 patients. With EASL criteria, 1-, 2-, and 3-year survival rates were 39% ± 10, 14% ± 7, and 0%, respectively, for N1N2 patients and 68% ± 10, 50% ± 11, and 37% ± 11 for N1R2 patients (P = .036, P = .006, and P < .005 at 1, 2, and 3 years). With mRECIST, 1-, 2-, and 3-year survival rates were 49% ± 9, 20% ± 8, and 7% ± 6 for N1N2 patients and 67% ± 9, 44% ± 10, and 36% ± 9 for N1R2 patients (P = .174, P = .046, and P = .011 at 1, 2, and 3 years). Numbers on horizontal axis are days after first chemoembolization.

