
Figure 5.
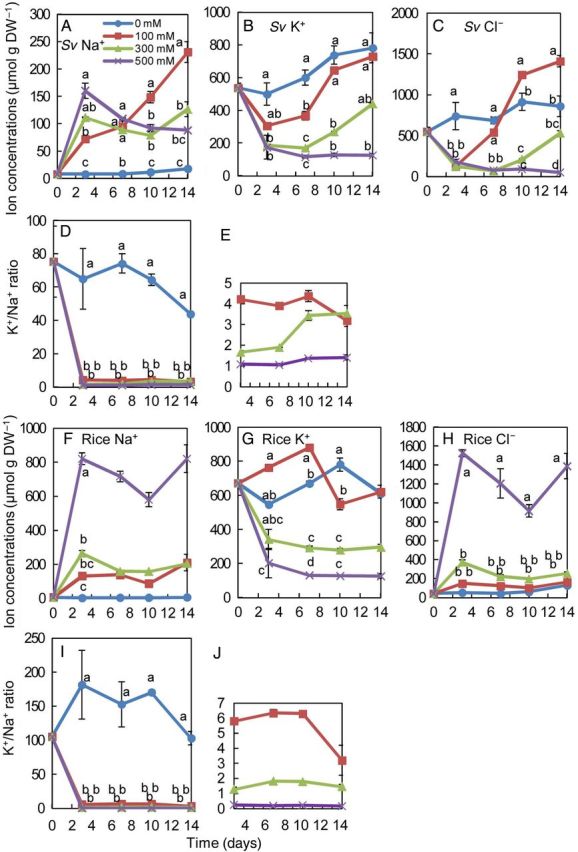
Ion concentration and ratios in cultured cells of S. virginicus and rice under different NaCl concentrations. Changes in Na+ (A), K+ (B) and Cl− (C) concentration and the K+/Na+ ratio in S. virginicus cultured cells (D and E) and Na+ (F), K+ (G) and Cl− (H) concentration and the K+/Na+ ratio (I and J) in rice cultured cells at 0, 3, 7, 10 and 14 days after salt treatments. Panels (E) and (J) are enlarged graphs of values for 100–500 mM NaCl in (D) and (I), respectively. Means with different letters for the same day are significantly different at P < 0.05 using Tukey's method.