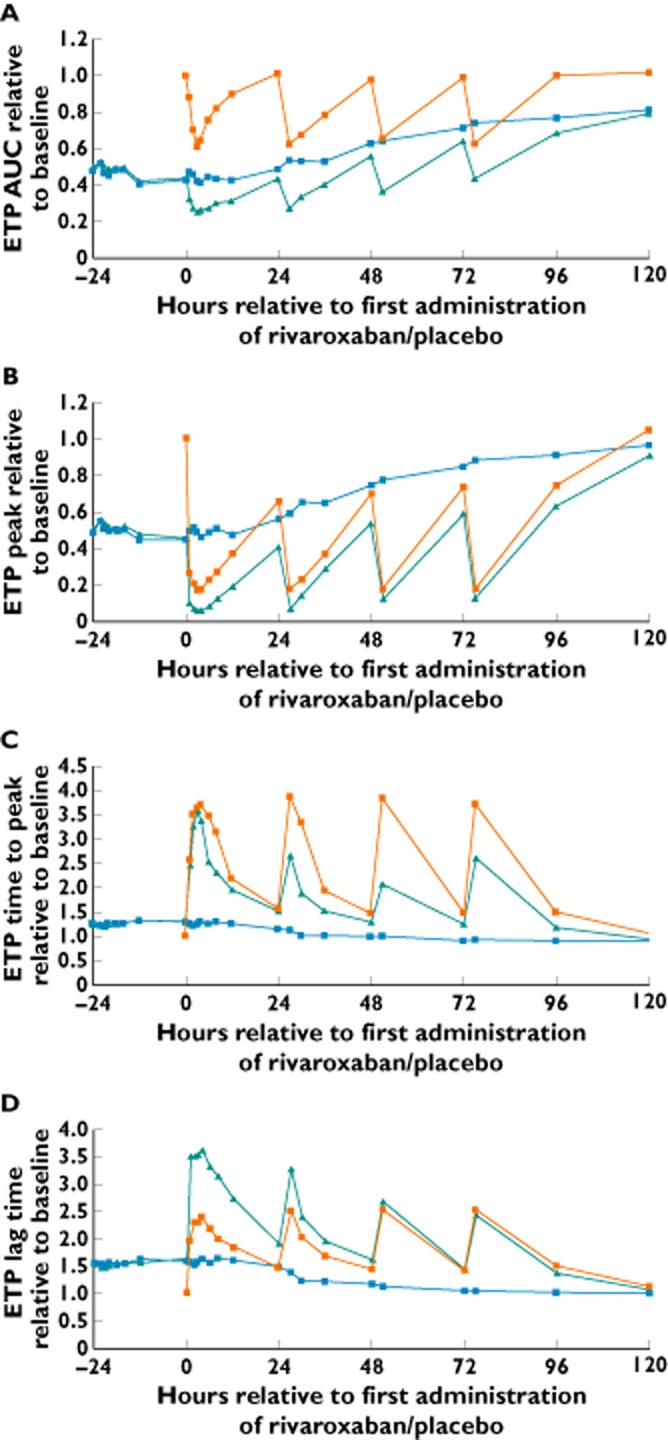
Figure 4.

Effects of administration of warfarin [international normalized ratio (INR) 2.0–3.0] followed by rivaroxaban 20 mg once daily (od; treatment A), warfarin (INR 2.0–3.0) followed by placebo od (treatment B) and rivaroxaban alone 20 mg od (treatment C) on endogenous thrombin potential (ETP), as follows: area under the effect–time curve (AUC; A), peak (B), time to peak (C) and lag time (D). Results are relative change expressed as median ratio to baseline (n = 24–28).  , warfarin/rivaroxaban;
  , warfarin/placebo;
  , rivaroxaban alone
