
Figure 3.
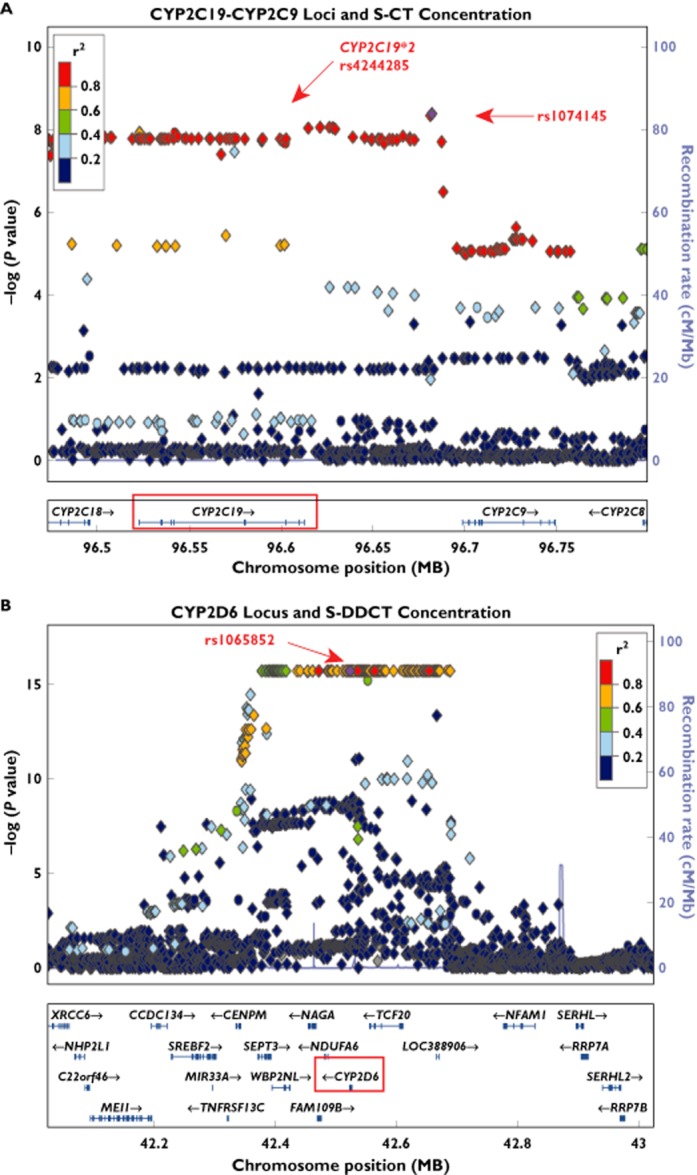
Locus Zoom [31] regional association plots for plasma S-CT and S-DDCT concentrations. (A) The CYP2C19–CYP2C9 locus and the S-CT concentration phenotype. (B) The CYP2D6 locus and the S-DDCT concentration phenotype. Diamond shapes represent imputed SNPs, while circles represent genotyped SNPs. Colours of the points represent linkage equilibrium relationships for the plotted markers with the rs1074145 SNP for the CYP2C19–CYP2C9 locus in (A) and the rs1065852 SNP for the CYP2D6 locus in (B), respectively. Associations with P values of 5 × 10⁻⁸ or less were considered genome-wide significant