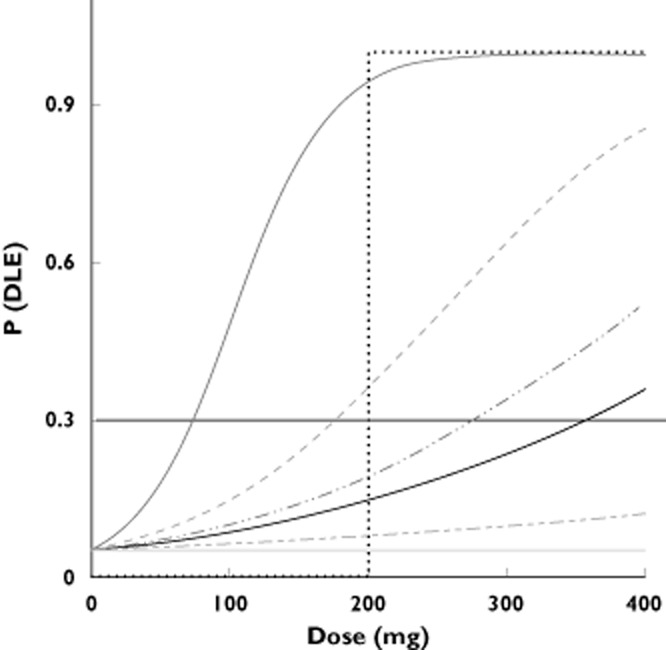
Figure 1.

P(DLE) as a function of dose for the seven dose–response scenarios. The title of each scenario gives P(DLE) at the maximum dose of 400 mg. The horizontal line at P(DLE) = 30% gives the MTD for each scenario. ( ) scenario 7: Abrupt at 200 mg, (
 ) scenario 6: Pr(DLE) 100%, (
 ) scenario 5: Pr(DLE) 85%, (
 ) scenario 4: Pr(DLE) 52%, (—) scenario 3: Pr(DLE) 35%, (
 ) scenario 2: Pr(DLE)12%, (
 ) scenario 1: Flat 5%
