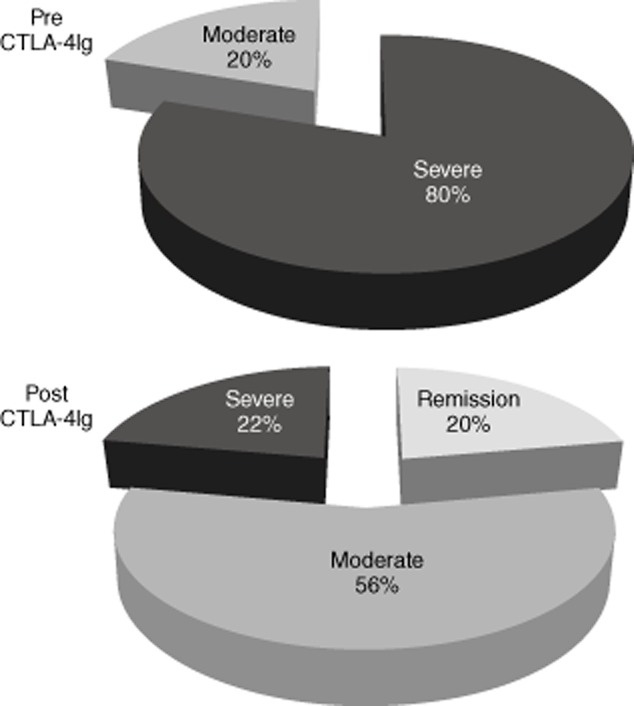
Figure 1.

Pie diagrams indicate the distribution of disease activity according to European League Against Rheumatism (EULAR) criteria in rheumatoid arthritis (RA) patients before and 6 months after therapy with abatacept [cytotoxic T lymphocyte antigen 4-immunoglobulin (Ig) [CTLA-4-Ig]. Severe disease is represented in black, moderate disease in grey and remission or low disease in light grey.
