Figure 2.

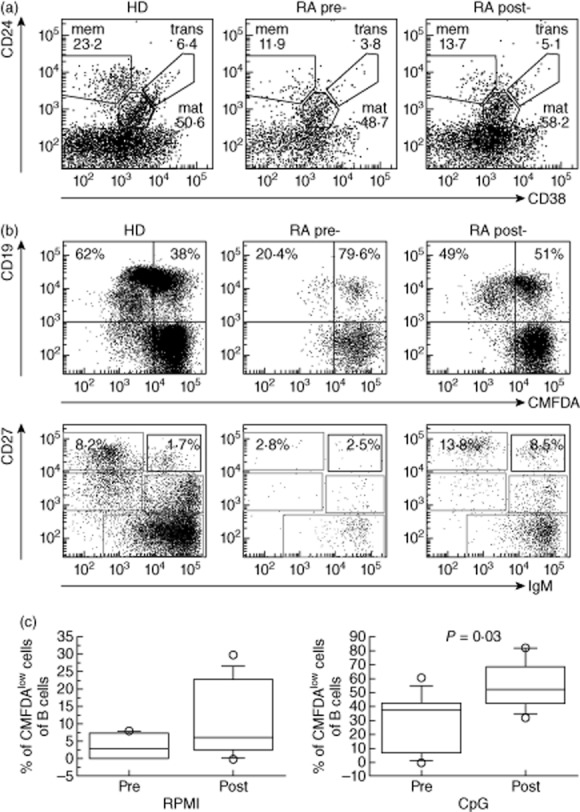
B cell subset analysis and B cell response to cytosine–phosphate–guanosine (CpG) in rheumatoid arthritis (RA) patients before and 6 months after treatment with abatacept. (a) Dot-plot shows a representative example of CD24 versus CD38 staining of peripheral blood lymphocytes (PBLs) from a healthy control (HD) and an RA patient before (pre) and after therapy (post), regions indicate: memory (mem), mature (mat) and transitional (trans) B cells and values correspond to the frequency of each B cell subset inside CD19pos cells. (b) PBLs pre-labelled with 5-chloromethylfluorescein diacetate (CMFDA) were stimulated with CpG for 7 days and analysed for B cell proliferation (upper panels) and plasma cell differentiation (lower panels). Values in the upper panel quadrants correspond to the frequency of proliferating and non-proliferating CD19pos cells. In lower panels the frequency of switched and immunoglobulin (Ig)M antibody secreting cells are indicated. (c) Box-plot graphs represent the median (solid line), interquartile ranges (boxes) and minimum and maximum non-outlier frequency values (whiskers) of proliferating CD19pos cells after culture without (RPMI) or with CpG. P-values are indicated when statistically differences were found between the two groups.
