
Fig. 2.
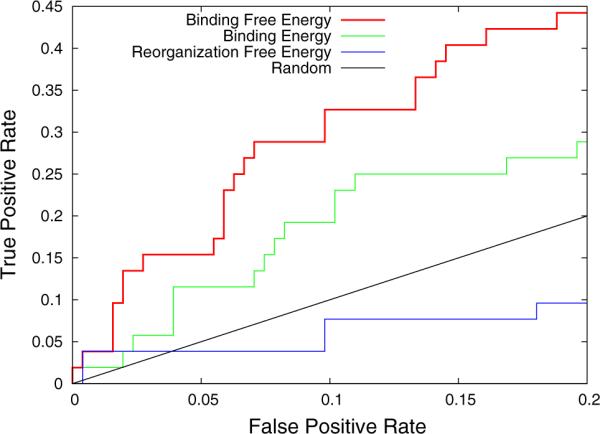
Early ROC curve for the classification of binders and non-binders to the LEDGF site of integrase. The ROC curve based on binding free energy rankings is in red (top), the ones based on binding energy rankings and reorganization free energy rankings are in green (middle) and blue (bottom) respectively. The straight black line is the 1:1 line corresponding to random picking. Results for sorting reorganization free energies from low to high are shown here, the reverse rankings yielded poorer performance