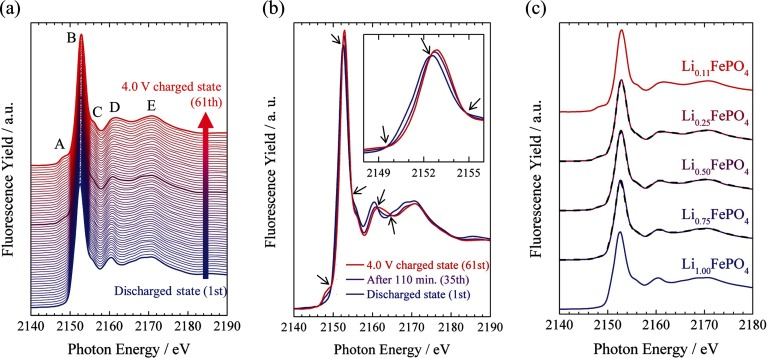
FIG. 4.
Observed P K-edge XAS spectra of the LiFePO4 composite electrode in the charging process recorded with the PFY mode. (a) Series of XAS spectra with fixed vertical offsets. Discharged state (1st), After 110 min (35th), and 4.0 V charged state (61th) are drawn by thick lines, respectively. (b) The XAS spectra of discharged state (1st), after 110 min (35th), and 4.0 V charged state (61th). Isosbestic points are shown by allows. (c) Series of XAS spectra as a function of the lithium ratio x in Li1-xFePO4 with fixed vertical offsets. Observed XAS spectra and synthetic spectra are solid and dashed lines, respectively. No data processing was performed, such as subtracting the pre-edge background and normalizing at the edge-jump, and correcting self-absorption effects for all the spectra.

