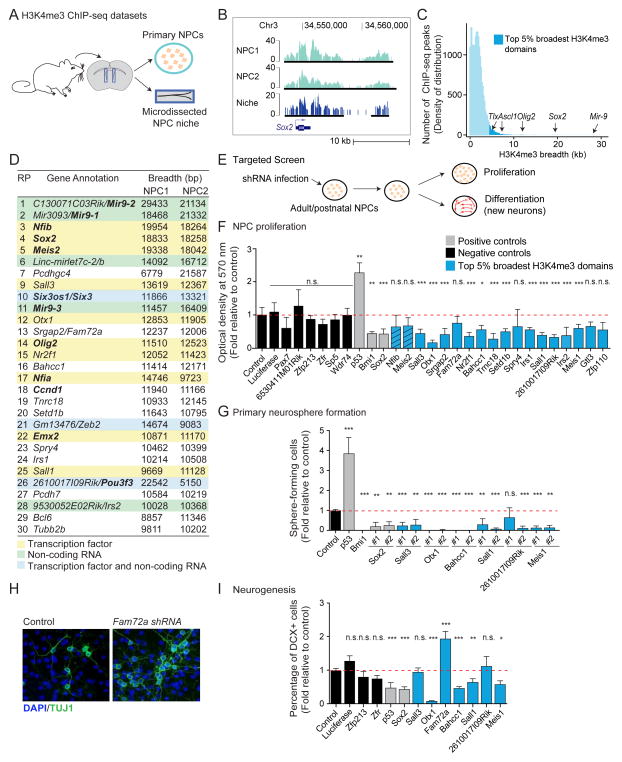
Figure 3. The top 5% broadest H3K4me3 domains can be used as a discovery tool to identify new regulators of neural progenitor cells.
In all panels: n.s. not significant; * p < 0.05; ** p < 0.01; *** p < 0.005 in a Wilcoxon test against control with Bonferroni correction for multiple testing.
A) Experimental design for H3K4me3 ChIP-seq datasets in primary cultures of neural progenitors (NPCs) and microdissected niche (subventricular zone).
B) H3K4me3 ChIP-seq peaks at a known NPC regulator in independent NPC primary cultures and in the NPC niche. Black bars: ChIP-seq peaks called by MACS2.
C) Distribution of H3K4me3 ChIP-seq peaks as a function of their breadth in NPCs reveals that known NPC regulators are marked by broad H3K4me3 domains.
D) Genes associated to top 30 broadest H3K4me3 domains in NPCs. Domains ranked by decreasing H3K4me3 breadth. Known regulators of NPCs in bold. RP: rank of rank product.
E) Experimental design to test the role of genes marked by top 5% broadest H3K4me3 domains in NPC proliferation and neurogenesis.
F) Proliferation capacity as normalized MTT optical density relative to control. Mean + SD of 2 independent experiments conducted in triplicate. Hashed blue bars: genes whose role in NPCs was discovered while this study was in preparation(Agoston et al., 2014; Ninkovic et al., 2013). See also Figure S3D.
G) Proliferation capacity as percentage of infected cells that formed primary neurospheres relative to control. Mean + SD of at least 2 independent experiments conducted in triplicate.
H) Images of new neurons upon Fam72a knock-down. Green: TUJ1 (neurons). Blue: DAPI (nuclei).
I) Neurogenesis measured by percentage of DCX+ cells (new neurons) normalized to control. Mean + SEM of at least 2 independent experiments conducted in triplicate. See also Figure S3F.

