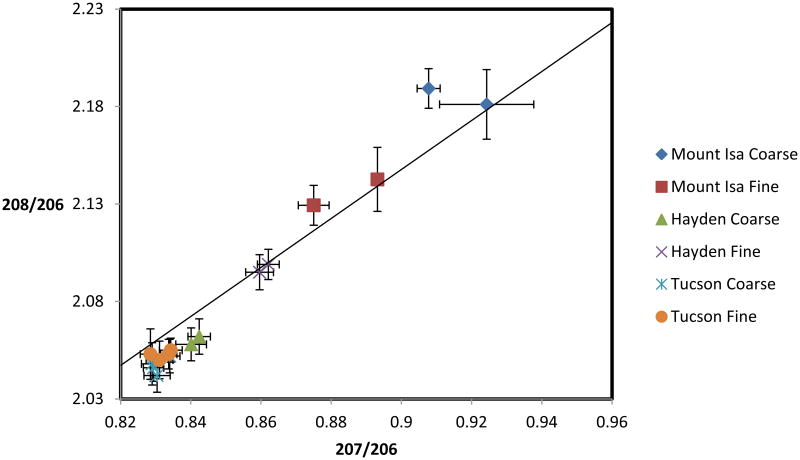
Figure 6.
Lead isotopic composition ratios of samples from various locations. Analysis samples were obtained by combining particles collected from various stages of the MOUDI sampler. Results are presented for two particle size ranges: 0.32 - 0.55 μm (fine particles) and 3.1 - 6.2 μm (coarse particles). The solid line is the growth curve, adapted from Chen et al. (2008) and developed by Cumming and Richards (1975).

