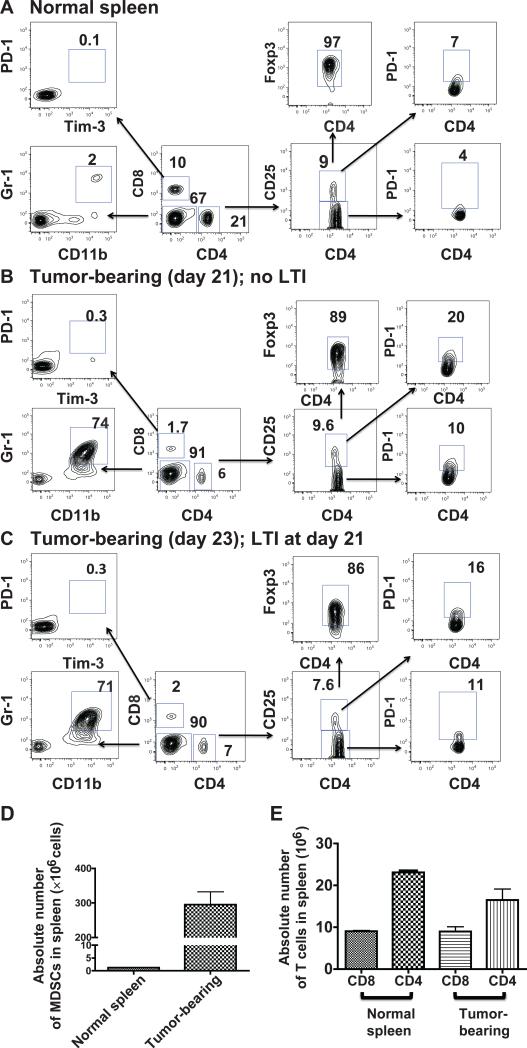
FIG. 3.
Analysis of T-cell subsets in spleens from normal and tumor-bearing mice. Panel A: Single cell suspensions were prepared from normal spleens and analyzed for expression of CD25, PD-1 and Tim-3 on CD4+ and CD8+ T cells and for MDSCs (CD11b+ Gr-11+). Percentages of each subset in boxes on representative two color analysis panels are shown and arrows identify gated subsets. Staining for CD11b, Gr-1, CD4 and CD8 used a mononuclear cell gate. Panel B shows the same analysis of spleens from tumor-bearing mice at day 21 after tumor induction. Panel C shows subset analysis just after local tumor irradiation 3 × 20 Gy (days 21, 22 and 23). Panel D: Absolute numbers of MDSCs in the spleens of normal and tumor-bearing (day 21) mice. Panel E: Absolute numbers of CD4+ and CD8+ T cells in normal and tumor-bearing mice (day 21).

