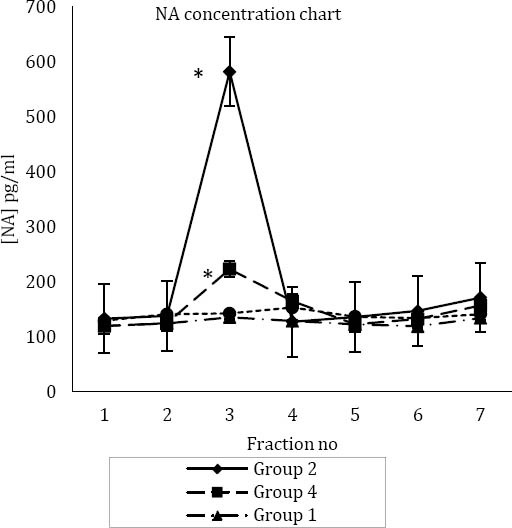
Figure 2.

(A) Mean±SEM concentration of noradrenaline (NA) in four study groups
*Significant difference with group 1, 3 and 4. (SC) in hind paw;
* *: Significant difference with group 1, 2 and 3
Fraction numbers are according to collection of microdialysis samples every 15 min
Group one (main control or control of formalin and tramadol test): injection of normal saline (IP) and injection of normal saline (SC) in right hind paw
Group two (control of tramadol test): injection of normal saline (IP) and injection of formalin (SC) in right hind paw
Group three (control of formalin test): injection of tramadol (IP) and injection of normal saline (SC) in right hind paw
Group four (main test group test): injection of tramadol (IP) and injection of formalin
