
Figure 7. Hemodynamic Assessment.
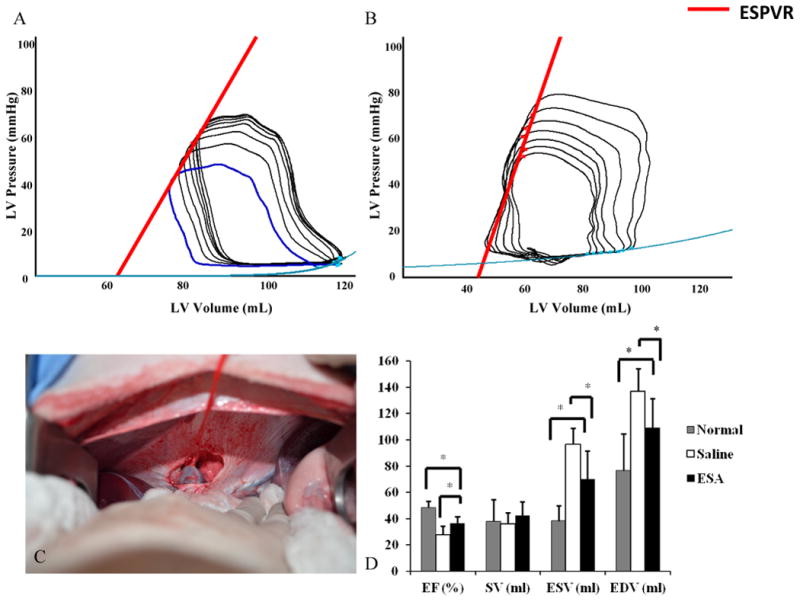
Pressure-volume loops were obtained during IVC occlusion for variable load data. (A-B) Representative PV loops from animals in the saline group and ESA group. Note the increased slope of the ESPVR (red line) in the ESA group, a pre-load independent measure of myocardial contractility. C, Before PV loop acquisition, a small upper midline laparotomy was performed and the suprahepatic IVC was dissected free and encircled with a vessel loop. This is a representative image of complete IVC occlusion by gentle retraction on the vessel loop. D, Animals in the ESA group had improved EF, lower ESV, and lower EDV compared to animals in the saline group, representing preserved LV function and limited LV remodeling. *p<0.05. EF = ejection fraction, SV = stroke volume, ESV = end systolic volume, EDV = end diastolic volume.