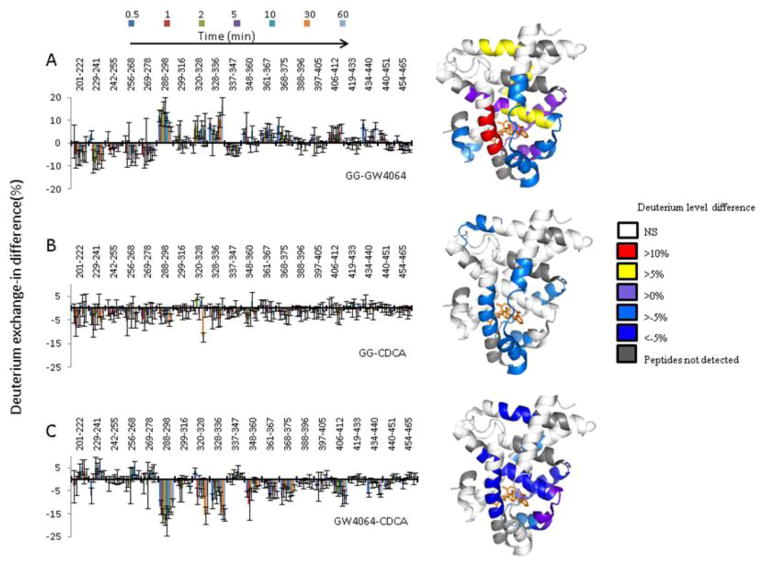
Figure 6.
Differential HDX data of FXR-LBD-agonist and FXR-LBD-antagonist. Left: Deuterium level differences in percentage (D %) from one complex to another are shown at different time points (0.5, 1, 2, 5, 10, 30, and 60 min, from left to right) for each peptide. Right: Average differences in deuterium percentage (D %) of seven time points (0.5, 1, 2, 5, 10, 30, and 60 min) were overlaid onto the crystallographic structure, PDB ID 3DCT for (A) and (B), PDB ID 1OSV for (C). Positive numbers indicate higher deuterium levels and thus less protection in the FXR-LBD-GG relative to the FXR-LBD-GW4064. Negative numbers indicate lower deuterium levels and thus more protection in the FXR-LBD-GG relative to the FXR-LBD-GW4064.

