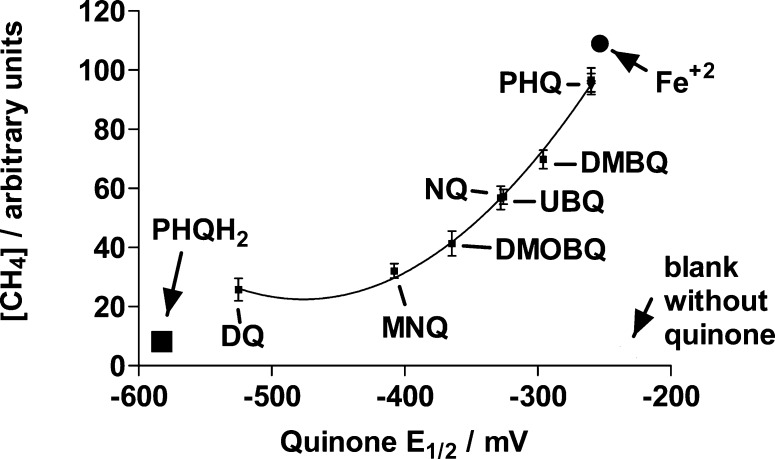
Figure 3.
Relative CH4 concentrations determined after a 40 min incubation of N2-saturated samples containing 10 μM quinone, 100 μM DETAPAC, 100 μM neocuproine, 10 mM ascorbate, and 2 mM H2O2 in 1:3 DMSO/phosphate buffer (20 mM, pH 7.4) (v/v). The symbols used to represent a blank sample without quinone, PHQH2, and Fe2+ are for solutions without quinone, with 10 μM PHQH2, or with 10 μM FeCl2, respectively, and correspond to the methane concentration, but not to the one-electron reduction potential, indicated by the position of the symbol. DETAPAC and neocuproine were not included in samples with FeCl2. The symbols ascribed to PHQ correspond to the same sample composition as that listed (■), with 10 μM DFO added (▲), or with 100 μM bathophenanthroline disulfonate and 100 μM ferrozine added (▼).

