
Figure 4.
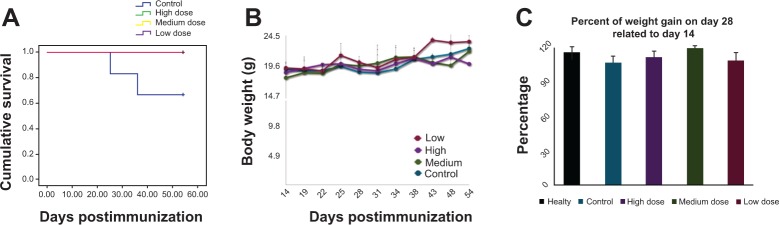
Effect of MSc1 on survival probability (A), the body weight of the mice (B) and percent of weight gain (C).
Notes: Mass changes are presented in this graph during days 14–54 (A); percentage of mass increase on days 28–14 postimmunization is shown (C). The medium dose had the best effect.