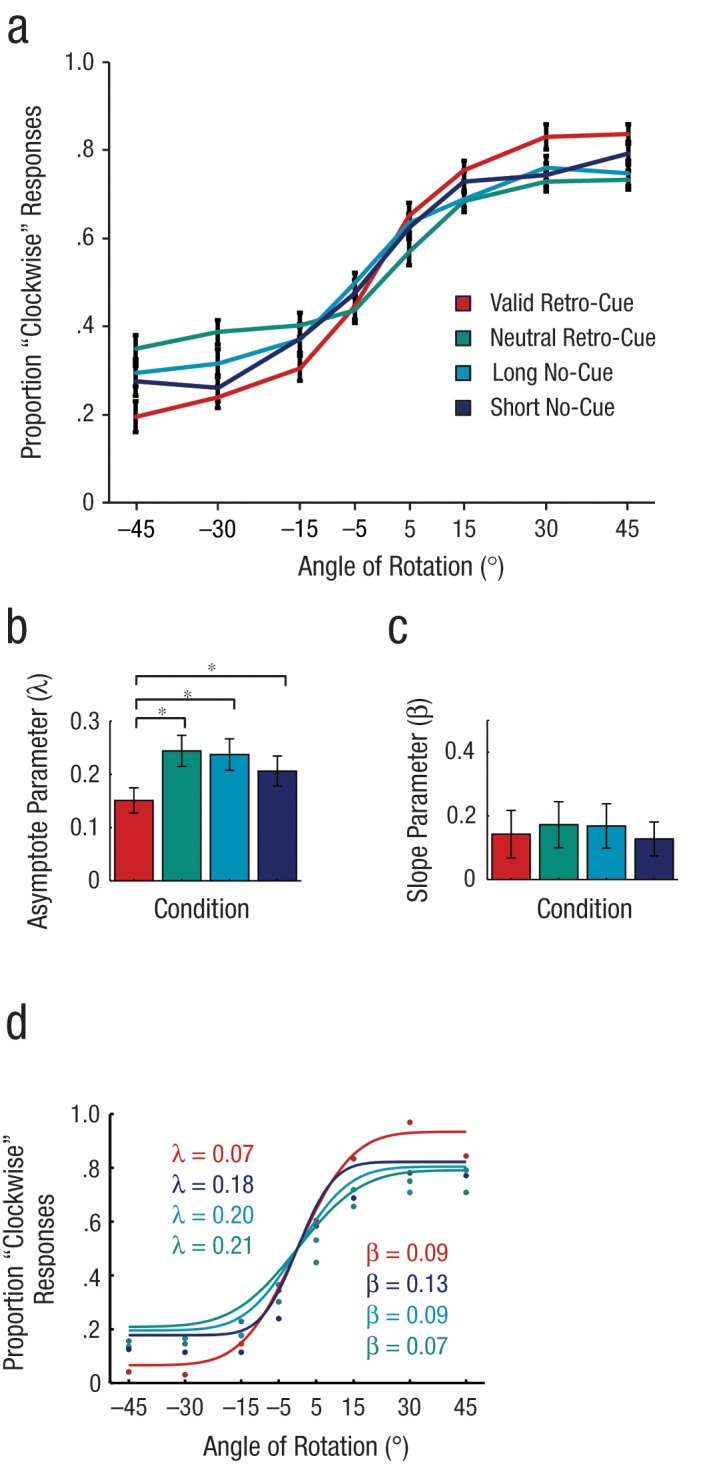
Fig. 2.

Behavioral results and parameter estimates for Experiment 2. In (a), the proportion of probes judged to have been rotated clockwise relative to the memory item is shown as a function of the probe’s angle of rotation for each of the four cuing conditions. The bar graphs show (b) estimates of the probability parameter (λ; lower numbers indicate higher probability of recall) and (c) estimates of the slope (β; higher numbers indicate greater precision) in each of the four cuing conditions. Asterisks indicate significant differences between conditions (p < .05). Error bars represent ±1 SEM. In (d), the proportion of “clockwise” responses in each condition is shown as a function of angle of rotation for 1 participant who completed four sessions of the task; the slope and asymptote parameters are also given for this subject. Each data point represents 96 trials (solid lines represent model fits).
