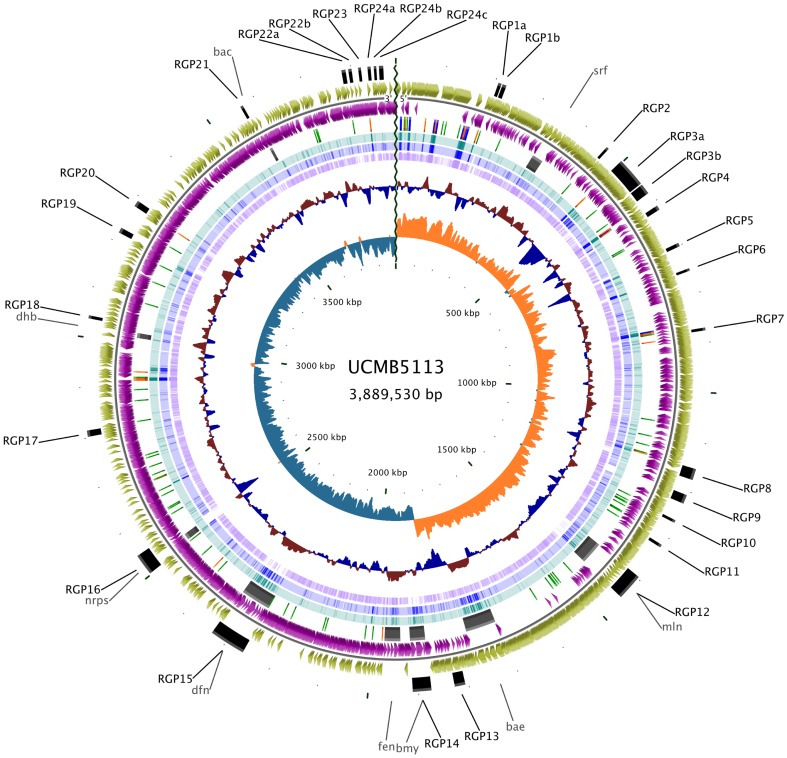
Figure 1. Graphical representation of genomic features of B. amyloliquefaciens subsp. plantarum UCMB5113.
Circles display (from the outside): (1) Sites of genome plasticity. (2) Predicted CDSs transcribed in the clockwise direction. (3) Predicted CDSs transcribed in the counterclockwise direction. (4) rRNA (blue), tRNA (orange), non-coding RNA (green), and NRPS/PKS gene clusters (grey). (5,6,7) Blast comparison of UCMB5113 genome with type strain FZB42T and B. subtilis 168, respectively. (8) GC percent deviation (GC window - mean GC) in a 1000-bp window. (9) GC skew (G+C/G-C) in a 1000-bp window.

