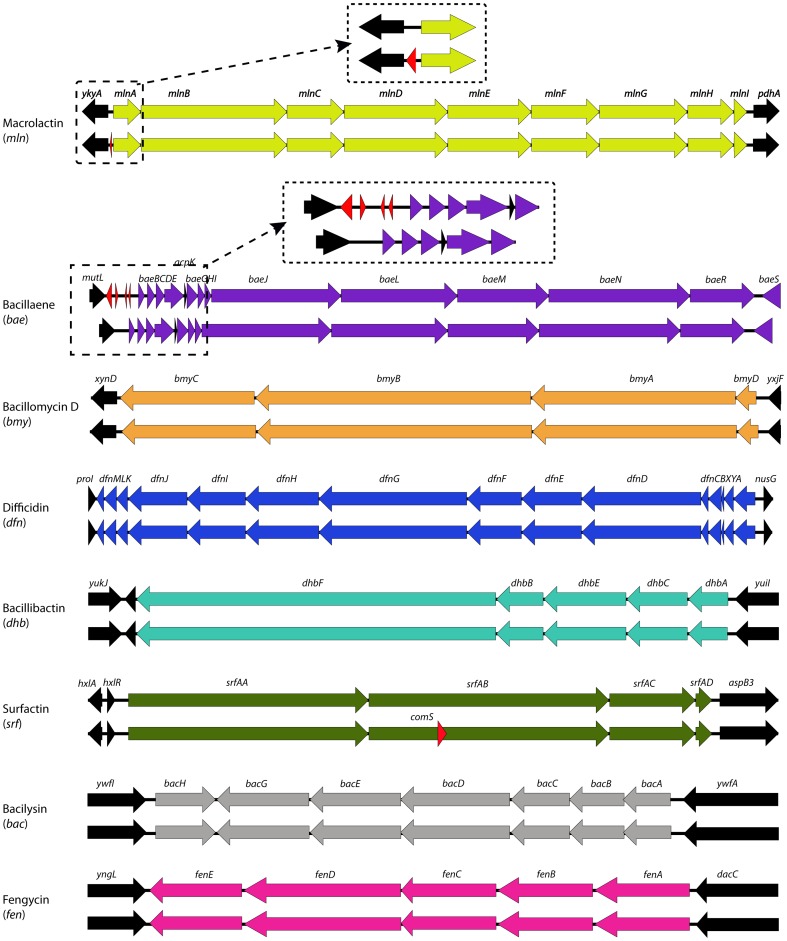
Figure 6. Blast comparison of NRPS/PKS clusters in UCMB5113 (above) and FZB42T(below).
Arrows indicate gene clusters; Macrolactin (light green), Bacilllaene (purple), BacillomycinD (orange), Difficidin (blue), Bacillibactin (turquoise), Surfactin (green), Bacilysin (grey), Fengycin (pink). Genes highlighted in red represent the differences where as black represent other genes flanking in each cluster.

