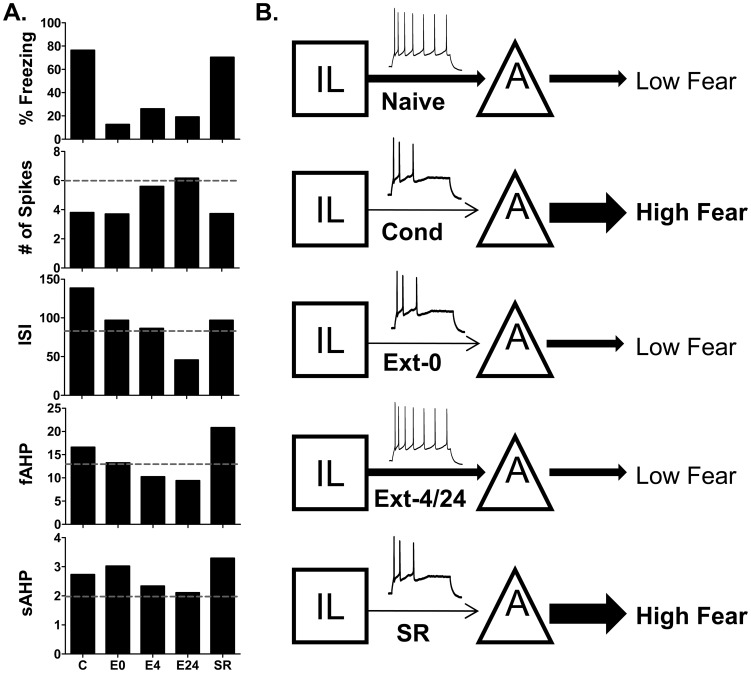
Figure 4. Summary and model of the changes in IL intrinsic excitability at different behavioral time-points.
A. Average values of the measured intrinsic parameters. C = COND, E0 = EXT-0, E4 = EXT-4, E24 = 24 hours after extinction, SR = Spontaneous Recovery. Dash-line indicates values of naïve group. Naïve and E24 values used with permission from the Journal of Neuroscience (Santini et al., 2008). B. Schematic representation of IL and amygdala interactions at different behavioral time-points.

