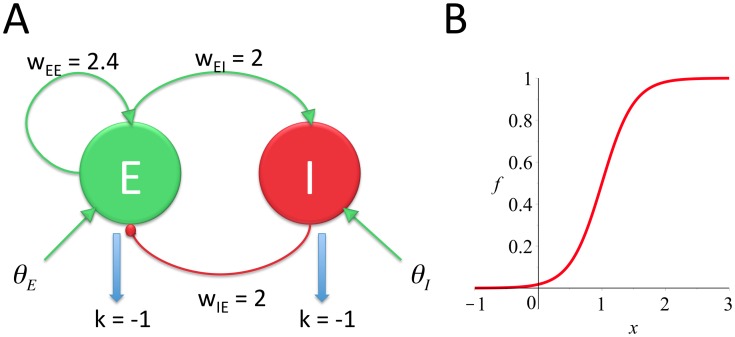
Figure 1. Diagrammatic representation of the PAC model (A) and the choice of sigmoidal response function (B).
A: grey arrows represent excitatory connections (+), black circles represent inhibitory connections (−). All weights in the model are positive, excitatory or inhibitory connections appear as +/− signs in the model equations (Equation (1)). External input can be received by either the E or the I population. Mid-grey arrows represent the leak in activity levels as a result of passive membrane properties. B: the exact shape of the sigmoid chosen (Equation (2)). The mean threshold is at x = 1. β = 4.

