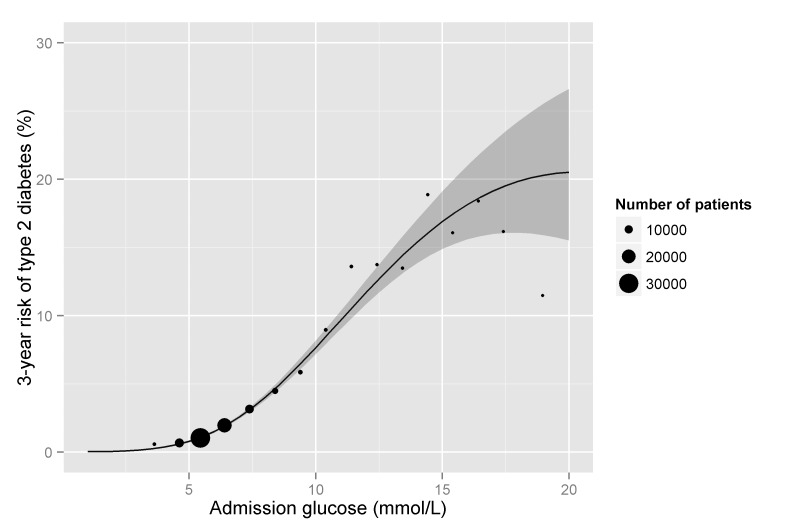
Figure 2. 3-year risk of type 2 diabetes by admission glucose.
The solid line represents the estimate and the ribbon represents the 95% CI obtained from a logistic regression model of incident type 2 diabetes on glucose, glucose-squared, and glucose-cubed. Points represent the risk of diabetes for patients categorised according to admission glucose, with the x-axis indicating the mean glucose level and the point size indicating the number of patients for each category.

