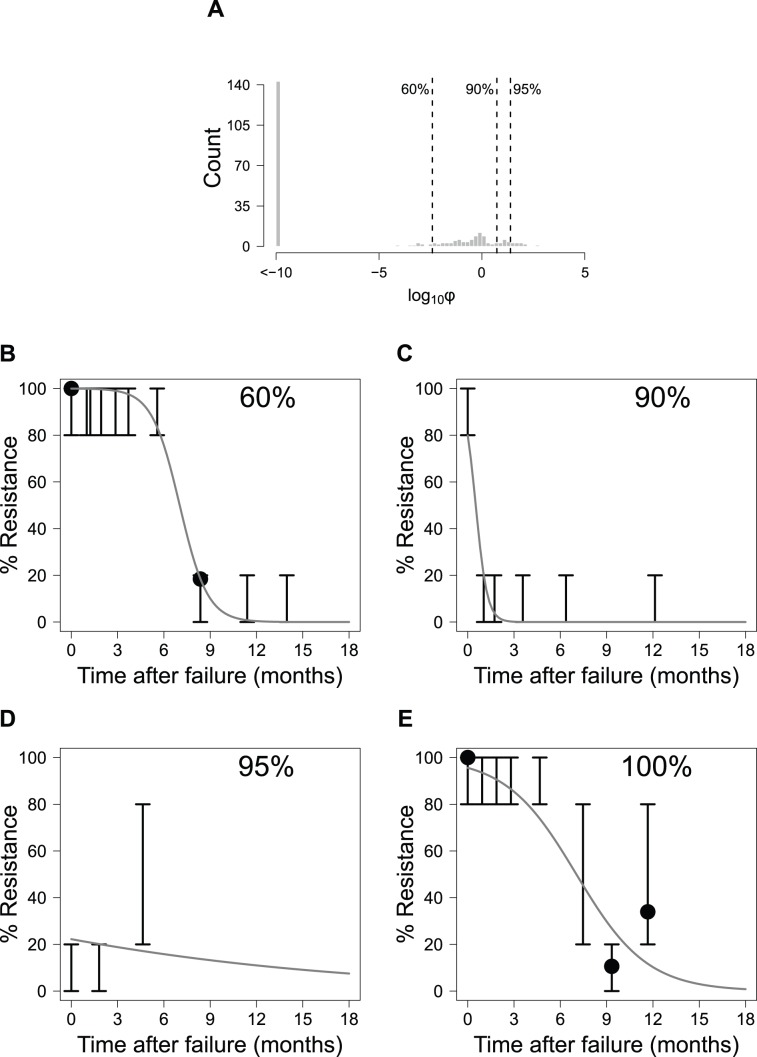
Figure 3. Model fit for patients with genotype 1a HCV.
(A): Histogram of the log10 objective function values (φ; see Equation 5) for all patients with genotype 1a. Dashed lines and numbers show quantile information for the fits. Also shown are representative fits for patients whose objective function values fall in the (B) 60%, (C) 90%, (D) 95%, and (E) 100% quantiles. Solid lines represent model predictions, solid points represent the clonal sequence data, and error bars show the range for population sequence results.

