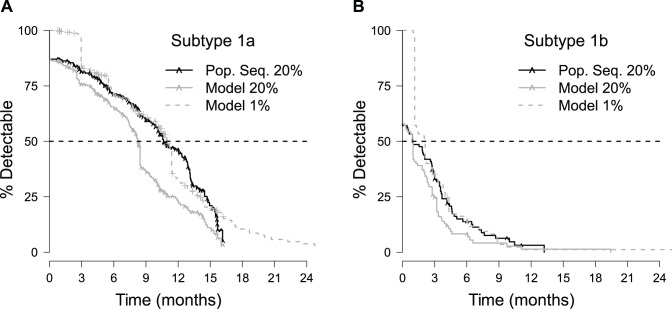
Figure 6. Kaplan-Meier curves for time-to-20% determined by population sequencing, model-predicted time-to-20%, and model-predicted time-to-1%.
Results for patients with HCV subtypes 1a and 1b are shown in plots (A) and (B), respectively. Hash marks (∧) denote the censored observations indicating the time of the last visit for patients with virus that did not revert to <20% resistant. For clarity, these patients are explicitly denoted on the population sequence (“Pop. Seq.”) and model-predicted time-to-20% resistance curves only.

