
Figure 2. Uptake of mannosylated and non-mannosylated SLPs.
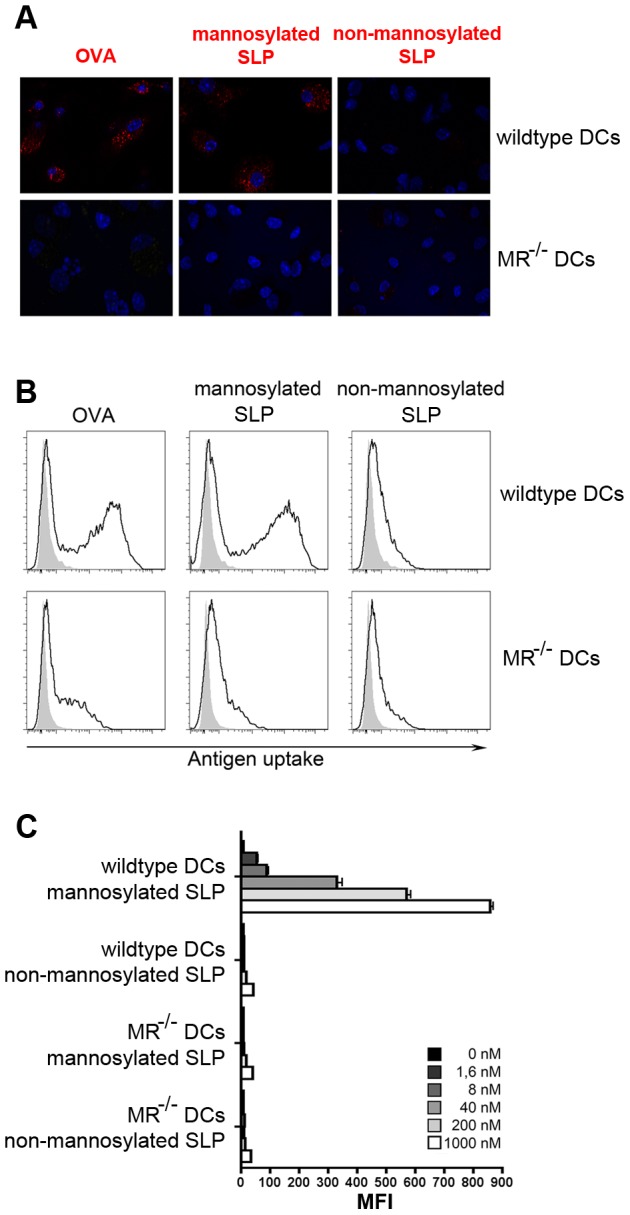
A) Wildtype or MR-deficient BM-DCs were incubated with 250 ng/ml fluorochrome-labeled OVA, 200 nM mannosylated SLPs or non-mannosylated SLPs for 15 min, chased with medium for 20 min and analyzed by immunofluorescence microscopy. Nuclei stained with DAPI are depicted in blue. B) Wildtype or MR-deficient BM-DCs were incubated with 250 ng/ml fluorochrome-labeled OVA, 200 nM mannosylated SLPs or non-mannosylated SLPs for 15 min. Antigen uptake was monitored by flow cytometry (gated on all living cells). C) Quantification of B) using different antigen concentrations. Depicted are representative results of at least 3 independent experiments. MFI: mean fluorescence intensity.