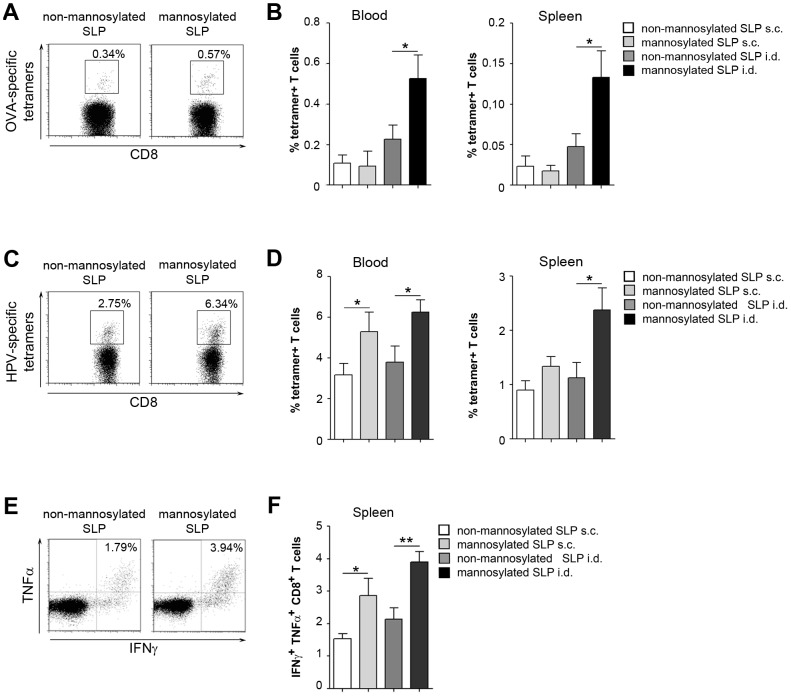
Figure 5. In vivo T cell activation by mannosylated SLPs.
A) Mice were injected i.d. with 75 µg of OVA-specific mannosylated or non-mannosylated SLPs and 20 µg CpG. After 7 days, antigen-specific T cells in the blood were monitored by flow cytometry using epitope-specific tetramers. Cells were gated for CD8. B) Quantitative analysis of epitope-specific T cells in the blood or in the spleen after s.c or i.d. injection of SLPs. Graphs show percentage of tetramer-positive CD8+ T cells. C) as in A) using HPV-specific SLPs. D) Quantitative analysis of epitope-specific T cells in the blood or in the spleen after s.c or i.d. injection of HPV-specific SLPs. E) Intracellular cytokine staining of splenic CD8+ T cells after i.d. injection of HPV-specific mannosylated or non-mannosylated peptides and CpG as above. F) Quantitative analysis of intracellular cytokines in T cells isolated from the spleen after s.c or i.d. injection of HPV-specific SLPs. Graphs show percentage of IFNγ+ TNFα+ cells amongst all CD8+ T cells. Dot plots depict representative results of 2 independent experiments. Bar graphs depict pooled results of 2 independent experiments (n = 9–10).

