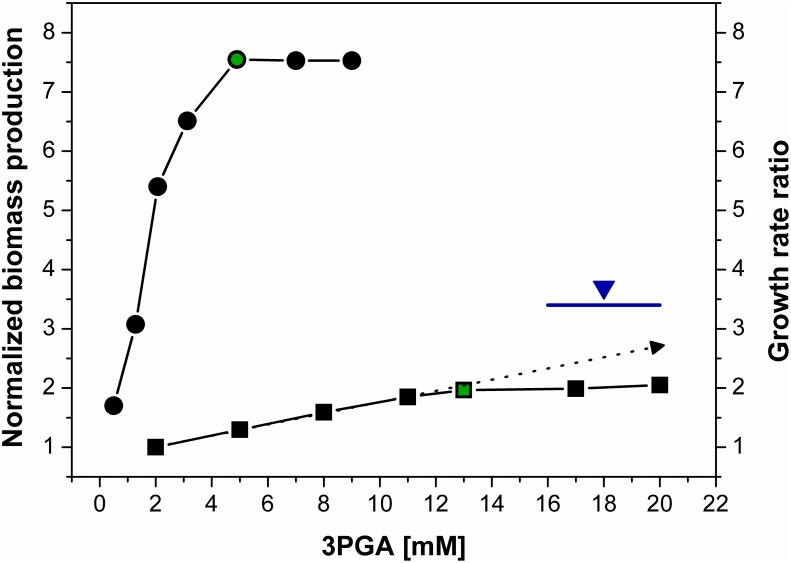
Figure 2. Simulated impact of 3PGA concentration on biomass production in Synechococcus 7942 cells grown under high and low CO2 conditions.
Black circles indicate simulated data for high CO2, and the green circle indicates the experimental measurement. Black squares indicate simulated data for low CO2, and the green square indicates the experimental measurement. The dotted arrow indicates the slope between the linear and saturated regions. The blue line (measured) and blue triangle (simulated at the experimental level of 3PGA) represent the growth ratio of high and low CO2. The first circle corresponds to the first square, the second circle corresponds to the second square, etc., representing the coupled data describing a shift from high to low CO2.

