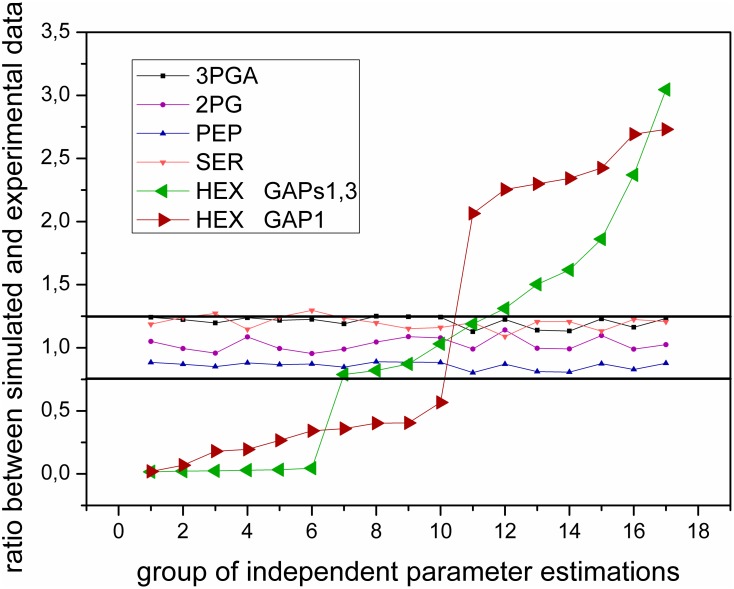
Figure 3. Impact of single GAP1 and dual GAP 1,3 regulation on metabolic levels cells of Synechococcus 7942.
Match between simulated and measured data in low CO2, depending on the estimated kinetic parameters (Vmax, km, and keqvalues) in high CO2 for GAP1 (red color) and GAPs1,3 (green color). HEX represents the mean value of sum of F6P, FBP, and G6P; their values were nearly identical, and this simplification was made to minimize the number of curves in one figure without losing any information. The black lines indicate ±25% difference region around the hypothetical perfect match value. Note: Parameter estimations are independent (similar to repeating experiments). However, to see the trend, the data were arranged from the lowest to the highest value. Every point represents many repetitions in parameter estimation that give the same result, which should identify all combinations and thus implies the existence of bifurcation behavior.

