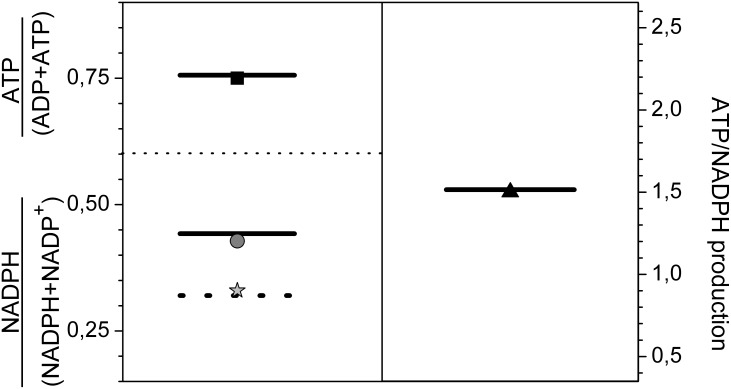
Figure 4. Homeostasis of ATP and NADPH in Synechococcus 7942 cells under changing CO2 conditions.
The upper left corner shows the match between the simulated (black line) and experimental values (solid square) of the ATP · (ADP+ATP)−1 ratio at both high and low CO2. The lower left section indicates the NADPH · (NADPH+NADP+)−1 ratio: grey circle for low CO2; grey asterisk for high CO2, grey dotted line for simulation in low CO2, with neglecting NAD co-regulation in the reaction catalyzed by GAPs, grey line for simulation in low CO2 with NAD replaced by NADPH in a reaction catalyzed by GAPs. The right section shows the measured and simulated ratio of ATP/NADPH production.

