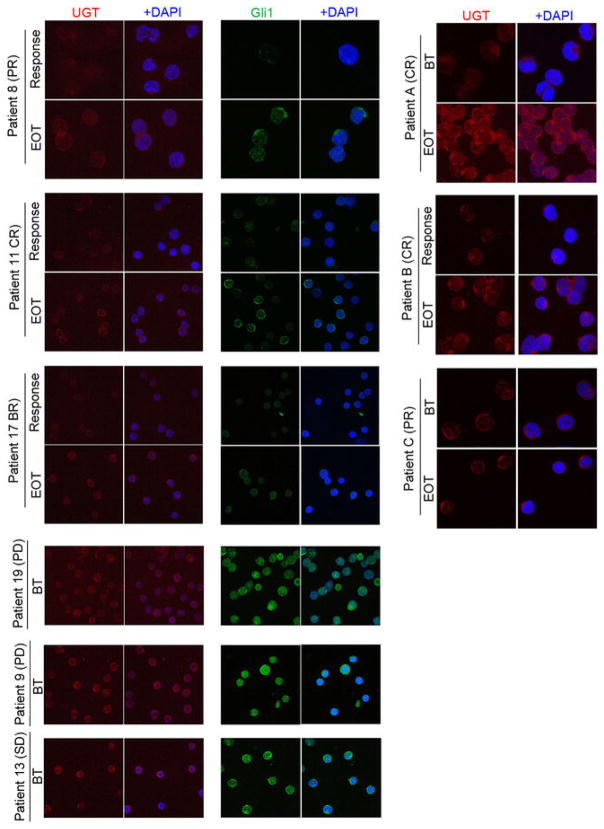
Figure 4.
Confocal micrographs of leukemic blasts isolated from bone marrows of responding and non-responding patients at before treatment (BT), Response or End of Treatment (EOT). Immunostaining for Gli1 and UGT1A are shown. DAPI is in blue. Note nuclear accumulation of Gli1 in non-responding patients, indicating elevated Gli1 activity. High levels of Gli1 and UGT1A suggest primary resistance. All confocal settings were identical between specimens and thus lower signal is indicative of less protein. A 100X objective with no digital zoom was used for patients 9, 11, 13, 17 and 19. The same objective but a digital zoom of 2X was used for patients 8, A, B and C. Note Patient C was still in remission at EOT (see main text). For each patient, staining was carried out three independent experiments. Controls for specificity of Gli1 and UGT1A antibodies are provided in Extended Data Figure 8.

