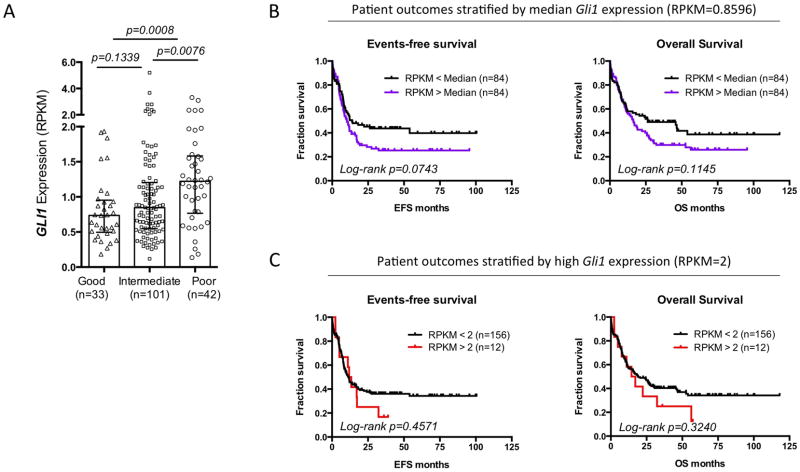
Figure 5.
Higher Gli1 expression is found in poor cytogenetic risk group and predicts a trend of worse survival outcome in AML. To study the prognostic value of Gli1 gene expression in AML, we mined the publicly available AML data set published by The Cancer Genome Atlas Research Network11 (A) Gli1 gene expression in 176 de novo AML patients grouped by cytogenetic risks. The expression level is represented by RPKM value which stands for Reads Per Kilobase of transcript per Million mapped reads in RNA-seq. Each patient is represented by a symbol. Error bars represent median ± IQR (Inter-Quartile Range) of each group. Nonparametric Mann-Whitney test was used to analyze the differences between groups. A total of 176 de novo AML patients with complete mRNA-seq and cytogenetic risk classification data are included in this analysis. (B, C) Kaplan-Meier plots of events-free survival (EFS) and overall survival (OS) of 168 de novo AML patients segregated by median Gli1 expression (RPKM=0.8596) (B) or high Gli1 expression (RPKM greater than or equal to 2) (C). Each tick on the survival curve represents a censored event because the patient is still alive at the end of the TCGA study. A total of 168 de novo AML patients with complete mRNA-seq, and reliable EFS, and OS data are included in this analysis (Patient information details are described in the Supplemental Table 1 of the NEJM study11. Mantel-Cox test was performed to calculate log-rank p values. We also observed that abnormally low levels of Gli1 were also correlated with poor outcome (data not shown), suggesting that Gli1 levels must be in a “Goldilocks” zone.

