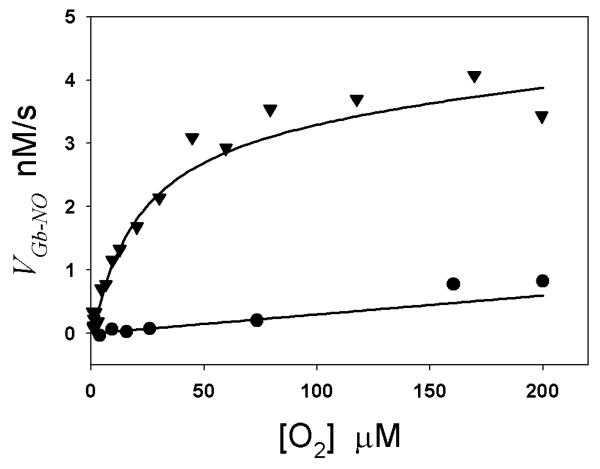
Fig. 3.
Simulated and measured VCygb-NO-[O2] and VMb-NO-[O2] curves at varying O2 concentrations. Experimental data VMb-NO (•) and VCygb-NO (▽) versus [O2] were obtained from Figs. 1A and 1B, respectively. The VMb-NO-[O2] and VCygb-NO-[O2] curves (solid lines) were simulated from Eqs. (7)&(8) and equations in our previous paper[9]. In the simulations, [NO] is 500 nM, Asc concentration is 0.3 mM, and all other parameters are listed in Table 1.

